Zip Codes with the Highest Percentage of Population Employed in Food Preparation & Serving in Wetumpka, AL
RELATED REPORTS & OPTIONS
Food Preparation & Serving
Wetumpka
Compare Zip Codes
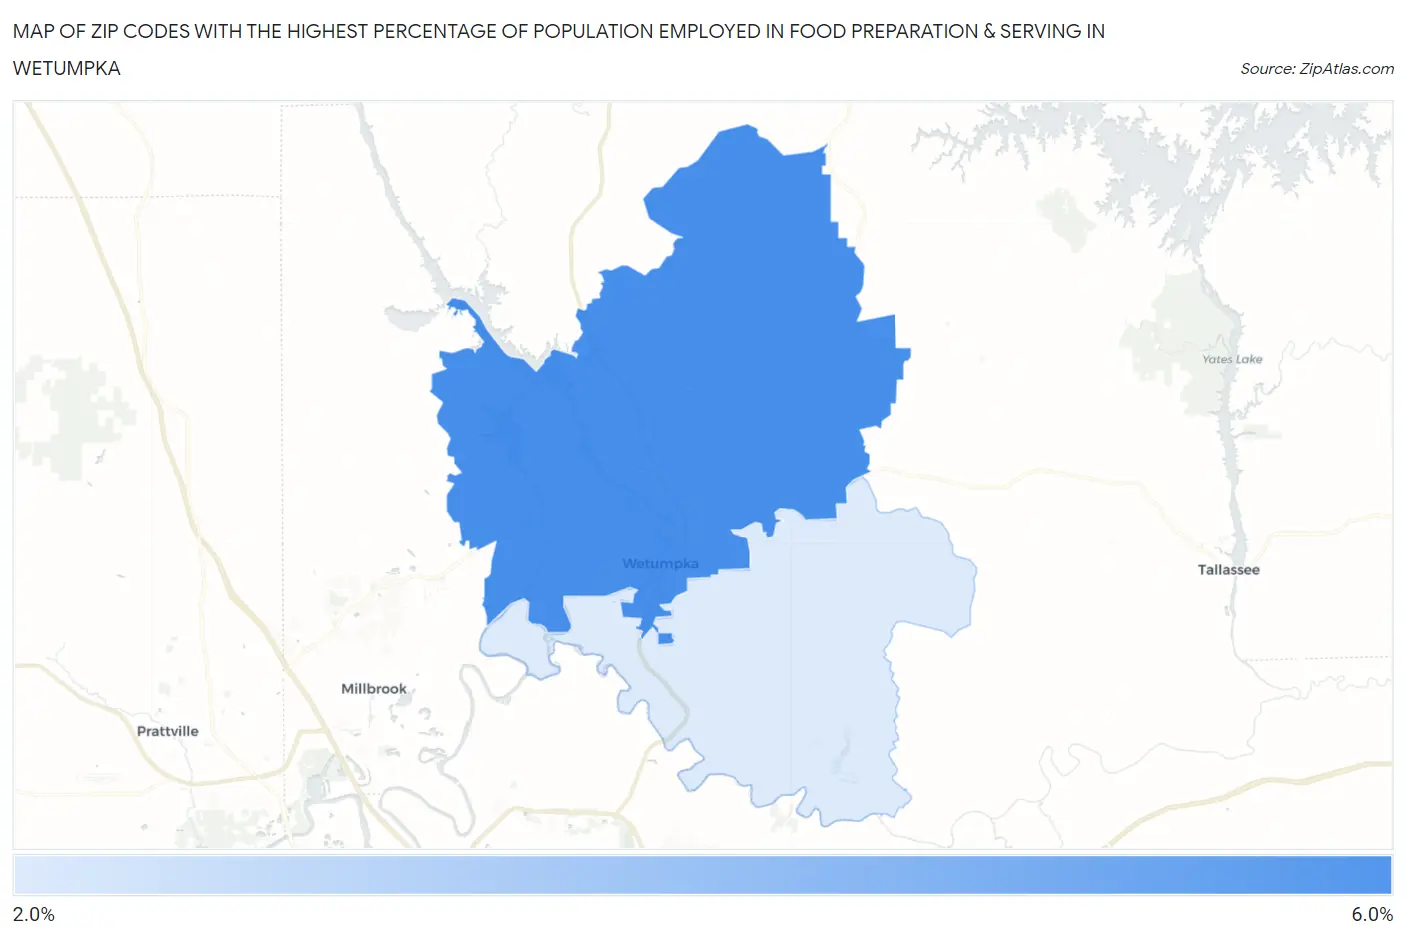
Map of Zip Codes with the Highest Percentage of Population Employed in Food Preparation & Serving in Wetumpka
2.0%
5.3%
Zip Codes with the Highest Percentage of Population Employed in Food Preparation & Serving in Wetumpka, AL
| Zip Code | % Employed | vs State | vs National | |
| 1. | 36092 | 5.3% | 5.2%(+0.090)#231 | 5.3%(+0.004)#11,806 |
| 2. | 36093 | 2.0% | 5.2%(-3.19)#451 | 5.3%(-3.28)#24,680 |
1
Common Questions
What are the Top Zip Codes with the Highest Percentage of Population Employed in Food Preparation & Serving in Wetumpka, AL?
Top Zip Codes with the Highest Percentage of Population Employed in Food Preparation & Serving in Wetumpka, AL are:
What zip code has the Highest Percentage of Population Employed in Food Preparation & Serving in Wetumpka, AL?
36092 has the Highest Percentage of Population Employed in Food Preparation & Serving in Wetumpka, AL with 5.3%.
What is the Percentage of Population Employed in Food Preparation & Serving in Wetumpka, AL?
Percentage of Population Employed in Food Preparation & Serving in Wetumpka is 4.7%.
What is the Percentage of Population Employed in Food Preparation & Serving in Alabama?
Percentage of Population Employed in Food Preparation & Serving in Alabama is 5.2%.
What is the Percentage of Population Employed in Food Preparation & Serving in the United States?
Percentage of Population Employed in Food Preparation & Serving in the United States is 5.3%.