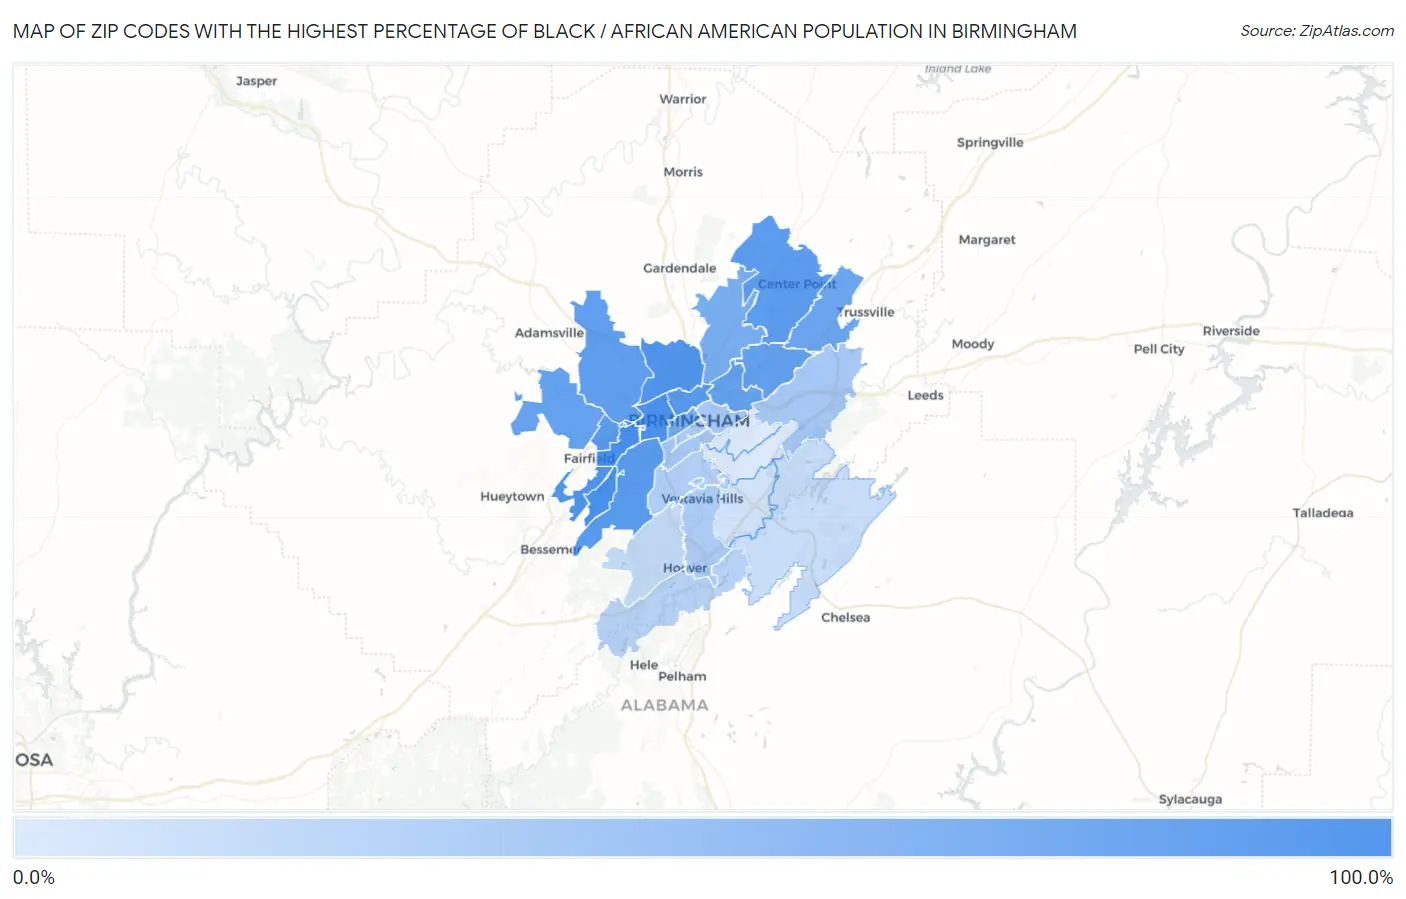
Zip Codes with the Highest Percentage of Black / African American Population in Birmingham, AL
RELATED REPORTS & OPTIONS
Black / African American
Birmingham
Compare Zip Codes
Map of Zip Codes with the Highest Percentage of Black / African American Population in Birmingham
0.91%
93.5%

Zip Codes with the Highest Percentage of Black / African American Population in Birmingham, AL
| Zip Code | Black / African American | vs State | vs National | |
| 1. | 35221 | 93.5% | 26.4%(+67.1)#16 | 12.5%(+81.0)#96 |
| 2. | 35208 | 93.4% | 26.4%(+67.0)#17 | 12.5%(+80.9)#99 |
| 3. | 35204 | 90.2% | 26.4%(+63.8)#22 | 12.5%(+77.7)#148 |
| 4. | 35228 | 87.3% | 26.4%(+60.9)#26 | 12.5%(+74.8)#201 |
| 5. | 35207 | 86.0% | 26.4%(+59.6)#28 | 12.5%(+73.5)#226 |
| 6. | 35211 | 80.5% | 26.4%(+54.1)#39 | 12.5%(+68.0)#311 |
| 7. | 35234 | 79.8% | 26.4%(+53.4)#43 | 12.5%(+67.3)#330 |
| 8. | 35218 | 79.7% | 26.4%(+53.3)#45 | 12.5%(+67.2)#334 |
| 9. | 35215 | 76.4% | 26.4%(+50.0)#55 | 12.5%(+63.9)#398 |
| 10. | 35214 | 74.1% | 26.4%(+47.7)#61 | 12.5%(+61.6)#453 |
| 11. | 35206 | 71.2% | 26.4%(+44.8)#67 | 12.5%(+58.8)#509 |
| 12. | 35224 | 70.1% | 26.4%(+43.7)#69 | 12.5%(+57.7)#546 |
| 13. | 35212 | 69.9% | 26.4%(+43.6)#71 | 12.5%(+57.5)#554 |
| 14. | 35235 | 64.0% | 26.4%(+37.7)#88 | 12.5%(+51.6)#727 |
| 15. | 35217 | 56.9% | 26.4%(+30.6)#103 | 12.5%(+44.5)#966 |
| 16. | 35203 | 56.0% | 26.4%(+29.7)#106 | 12.5%(+43.6)#1,001 |
| 17. | 35249 | 47.6% | 26.4%(+21.2)#138 | 12.5%(+35.1)#1,372 |
| 18. | 35254 | 32.8% | 26.4%(+6.43)#206 | 12.5%(+20.3)#2,400 |
| 19. | 35210 | 28.6% | 26.4%(+2.25)#225 | 12.5%(+16.2)#2,797 |
| 20. | 35229 | 28.0% | 26.4%(+1.62)#232 | 12.5%(+15.5)#2,848 |
| 21. | 35205 | 27.9% | 26.4%(+1.51)#234 | 12.5%(+15.4)#2,860 |
| 22. | 35222 | 27.8% | 26.4%(+1.44)#235 | 12.5%(+15.3)#2,866 |
| 23. | 35233 | 25.3% | 26.4%(-1.12)#250 | 12.5%(+12.8)#3,186 |
| 24. | 35216 | 25.0% | 26.4%(-1.42)#251 | 12.5%(+12.5)#3,218 |
| 25. | 35209 | 23.0% | 26.4%(-3.40)#263 | 12.5%(+10.5)#3,492 |
| 26. | 35244 | 18.3% | 26.4%(-8.04)#294 | 12.5%(+5.87)#4,246 |
| 27. | 35226 | 12.9% | 26.4%(-13.5)#355 | 12.5%(+0.400)#5,579 |
| 28. | 35242 | 10.3% | 26.4%(-16.1)#384 | 12.5%(-2.14)#6,498 |
| 29. | 35243 | 5.8% | 26.4%(-20.6)#438 | 12.5%(-6.66)#8,885 |
| 30. | 35223 | 2.1% | 26.4%(-24.3)#506 | 12.5%(-10.4)#13,420 |
| 31. | 35213 | 0.91% | 26.4%(-25.5)#537 | 12.5%(-11.6)#16,909 |
1
Common Questions
What are the Top 10 Zip Codes with the Highest Percentage of Black / African American Population in Birmingham, AL?
Top 10 Zip Codes with the Highest Percentage of Black / African American Population in Birmingham, AL are:
What zip code has the Highest Percentage of Black / African American Population in Birmingham, AL?
35221 has the Highest Percentage of Black / African American Population in Birmingham, AL with 93.5%.
What is the Percentage of Black / African American Population in Birmingham, AL?
Percentage of Black / African American Population in Birmingham is 68.6%.
What is the Percentage of Black / African American Population in Alabama?
Percentage of Black / African American Population in Alabama is 26.4%.
What is the Percentage of Black / African American Population in the United States?
Percentage of Black / African American Population in the United States is 12.5%.