Zip Codes with the Highest Percentage of Population Employed in Food Preparation & Serving in Dothan, AL
RELATED REPORTS & OPTIONS
Food Preparation & Serving
Dothan
Compare Zip Codes
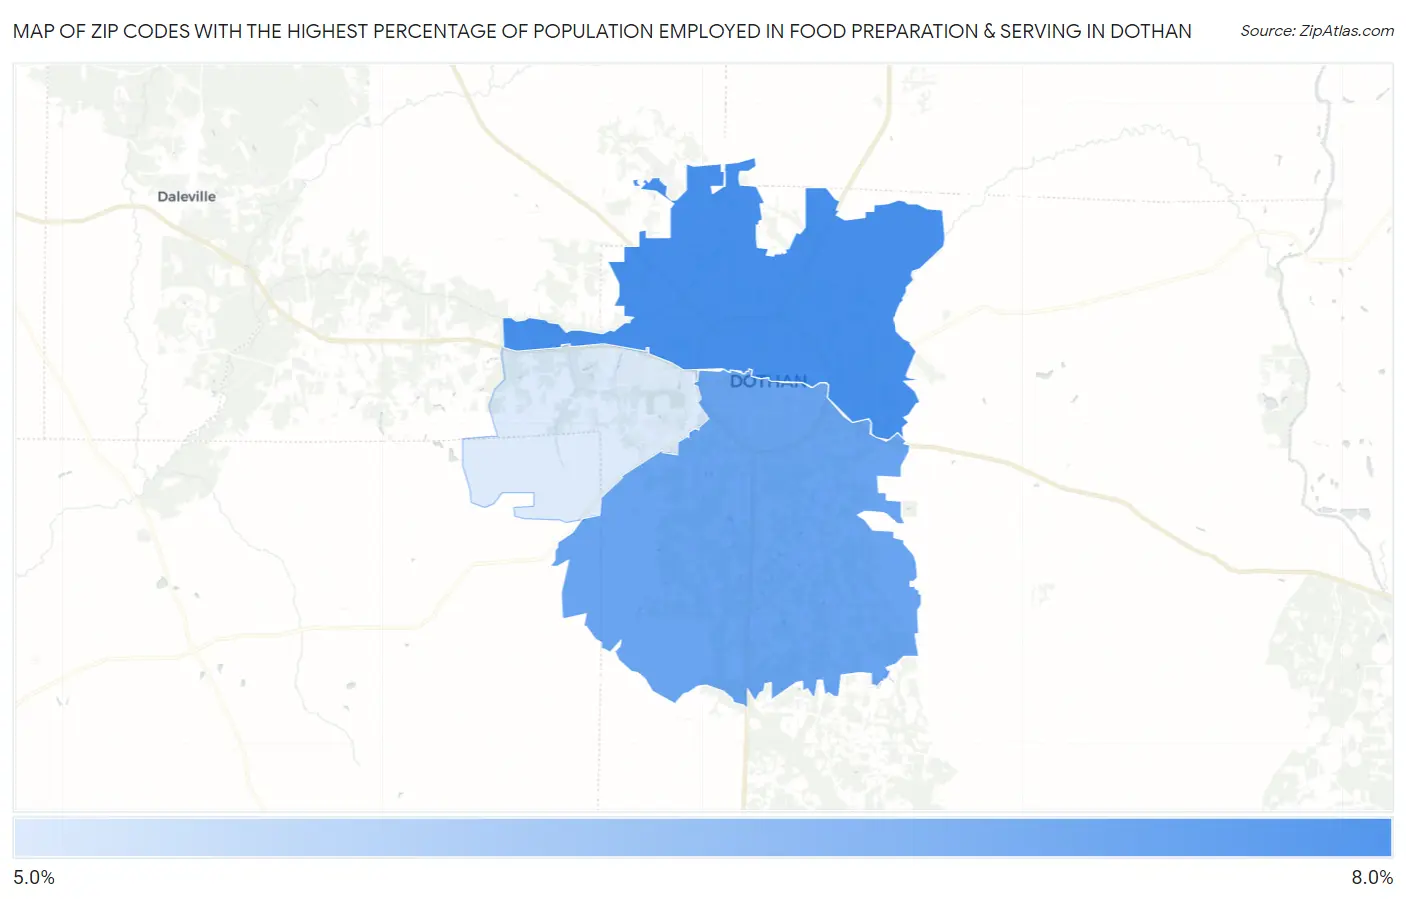
Map of Zip Codes with the Highest Percentage of Population Employed in Food Preparation & Serving in Dothan
5.7%
7.0%
Zip Codes with the Highest Percentage of Population Employed in Food Preparation & Serving in Dothan, AL
| Zip Code | % Employed | vs State | vs National | |
| 1. | 36303 | 7.0% | 5.2%(+1.77)#136 | 5.3%(+1.68)#6,644 |
| 2. | 36301 | 6.7% | 5.2%(+1.46)#148 | 5.3%(+1.38)#7,442 |
| 3. | 36305 | 5.7% | 5.2%(+0.453)#200 | 5.3%(+0.367)#10,508 |
1
Common Questions
What are the Top Zip Codes with the Highest Percentage of Population Employed in Food Preparation & Serving in Dothan, AL?
Top Zip Codes with the Highest Percentage of Population Employed in Food Preparation & Serving in Dothan, AL are:
What zip code has the Highest Percentage of Population Employed in Food Preparation & Serving in Dothan, AL?
36303 has the Highest Percentage of Population Employed in Food Preparation & Serving in Dothan, AL with 7.0%.
What is the Percentage of Population Employed in Food Preparation & Serving in Dothan, AL?
Percentage of Population Employed in Food Preparation & Serving in Dothan is 6.7%.
What is the Percentage of Population Employed in Food Preparation & Serving in Alabama?
Percentage of Population Employed in Food Preparation & Serving in Alabama is 5.2%.
What is the Percentage of Population Employed in Food Preparation & Serving in the United States?
Percentage of Population Employed in Food Preparation & Serving in the United States is 5.3%.