Zip Codes with the Highest Percentage of Households with Income Above $200,000 in Birmingham, AL
RELATED REPORTS & OPTIONS
Household Income | $200k+
Birmingham
Compare Zip Codes
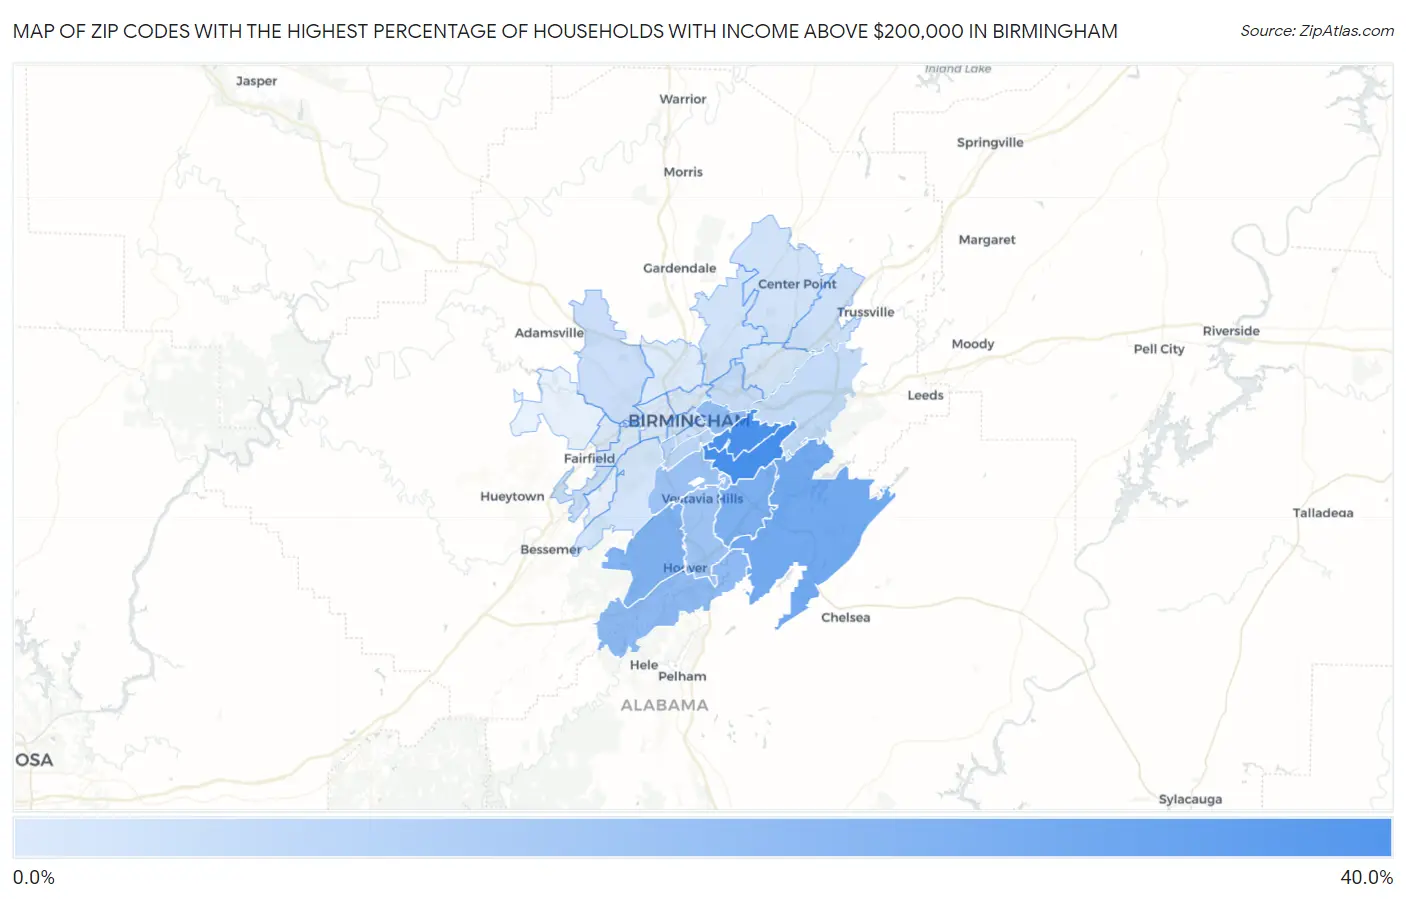
Map of Zip Codes with the Highest Percentage of Households with Income Above $200,000 in Birmingham
0.10%
37.0%
Zip Codes with the Highest Percentage of Households with Income Above $200,000 in Birmingham, AL
| Zip Code | Households with Income > $200k | vs State | vs National | |
| 1. | 35223 | 37.0% | 6.5%(+30.5)#2 | 11.4%(+25.6)#837 |
| 2. | 35213 | 35.6% | 6.5%(+29.1)#3 | 11.4%(+24.2)#928 |
| 3. | 35242 | 24.8% | 6.5%(+18.3)#9 | 11.4%(+13.4)#2,219 |
| 4. | 35243 | 22.7% | 6.5%(+16.2)#13 | 11.4%(+11.3)#2,624 |
| 5. | 35226 | 21.6% | 6.5%(+15.1)#16 | 11.4%(+10.2)#2,865 |
| 6. | 35244 | 18.1% | 6.5%(+11.6)#22 | 11.4%(+6.70)#3,808 |
| 7. | 35222 | 16.7% | 6.5%(+10.2)#29 | 11.4%(+5.30)#4,298 |
| 8. | 35209 | 14.4% | 6.5%(+7.90)#37 | 11.4%(+3.00)#5,256 |
| 9. | 35216 | 13.8% | 6.5%(+7.30)#41 | 11.4%(+2.40)#5,560 |
| 10. | 35205 | 7.8% | 6.5%(+1.30)#101 | 11.4%(-3.60)#10,630 |
| 11. | 35210 | 5.5% | 6.5%(-1.00)#181 | 11.4%(-5.90)#14,523 |
| 12. | 35212 | 4.6% | 6.5%(-1.90)#221 | 11.4%(-6.80)#16,576 |
| 13. | 35203 | 4.2% | 6.5%(-2.30)#242 | 11.4%(-7.20)#17,660 |
| 14. | 35228 | 4.1% | 6.5%(-2.40)#247 | 11.4%(-7.30)#17,887 |
| 15. | 35214 | 3.8% | 6.5%(-2.70)#269 | 11.4%(-7.60)#18,623 |
| 16. | 35233 | 3.6% | 6.5%(-2.90)#280 | 11.4%(-7.80)#19,282 |
| 17. | 35235 | 3.5% | 6.5%(-3.00)#281 | 11.4%(-7.90)#19,462 |
| 18. | 35215 | 2.6% | 6.5%(-3.90)#359 | 11.4%(-8.80)#21,995 |
| 19. | 35217 | 2.5% | 6.5%(-4.00)#374 | 11.4%(-8.90)#22,373 |
| 20. | 35211 | 2.0% | 6.5%(-4.50)#406 | 11.4%(-9.40)#23,753 |
| 21. | 35206 | 1.7% | 6.5%(-4.80)#428 | 11.4%(-9.70)#24,566 |
| 22. | 35208 | 1.2% | 6.5%(-5.30)#468 | 11.4%(-10.2)#25,765 |
| 23. | 35234 | 1.1% | 6.5%(-5.40)#479 | 11.4%(-10.3)#26,012 |
| 24. | 35218 | 0.80% | 6.5%(-5.70)#496 | 11.4%(-10.6)#26,568 |
| 25. | 35204 | 0.40% | 6.5%(-6.10)#515 | 11.4%(-11.0)#27,253 |
| 26. | 35207 | 0.10% | 6.5%(-6.40)#522 | 11.4%(-11.3)#27,543 |
1
Common Questions
What are the Top 10 Zip Codes with the Highest Percentage of Households with Income Above $200,000 in Birmingham, AL?
Top 10 Zip Codes with the Highest Percentage of Households with Income Above $200,000 in Birmingham, AL are:
What zip code has the Highest Percentage of Households with Income Above $200,000 in Birmingham, AL?
35223 has the Highest Percentage of Households with Income Above $200,000 in Birmingham, AL with 37.0%.
What is the Percentage of Households with Income Above $200,000 in Birmingham, AL?
Percentage of Households with Income Above $200,000 in Birmingham is 4.3%.
What is the Percentage of Households with Income Above $200,000 in Alabama?
Percentage of Households with Income Above $200,000 in Alabama is 6.5%.
What is the Percentage of Households with Income Above $200,000 in the United States?
Percentage of Households with Income Above $200,000 in the United States is 11.4%.