Zip Codes with the Highest Percentage of Population Employed in Material Moving in Birmingham, AL
RELATED REPORTS & OPTIONS
Material Moving
Birmingham
Compare Zip Codes
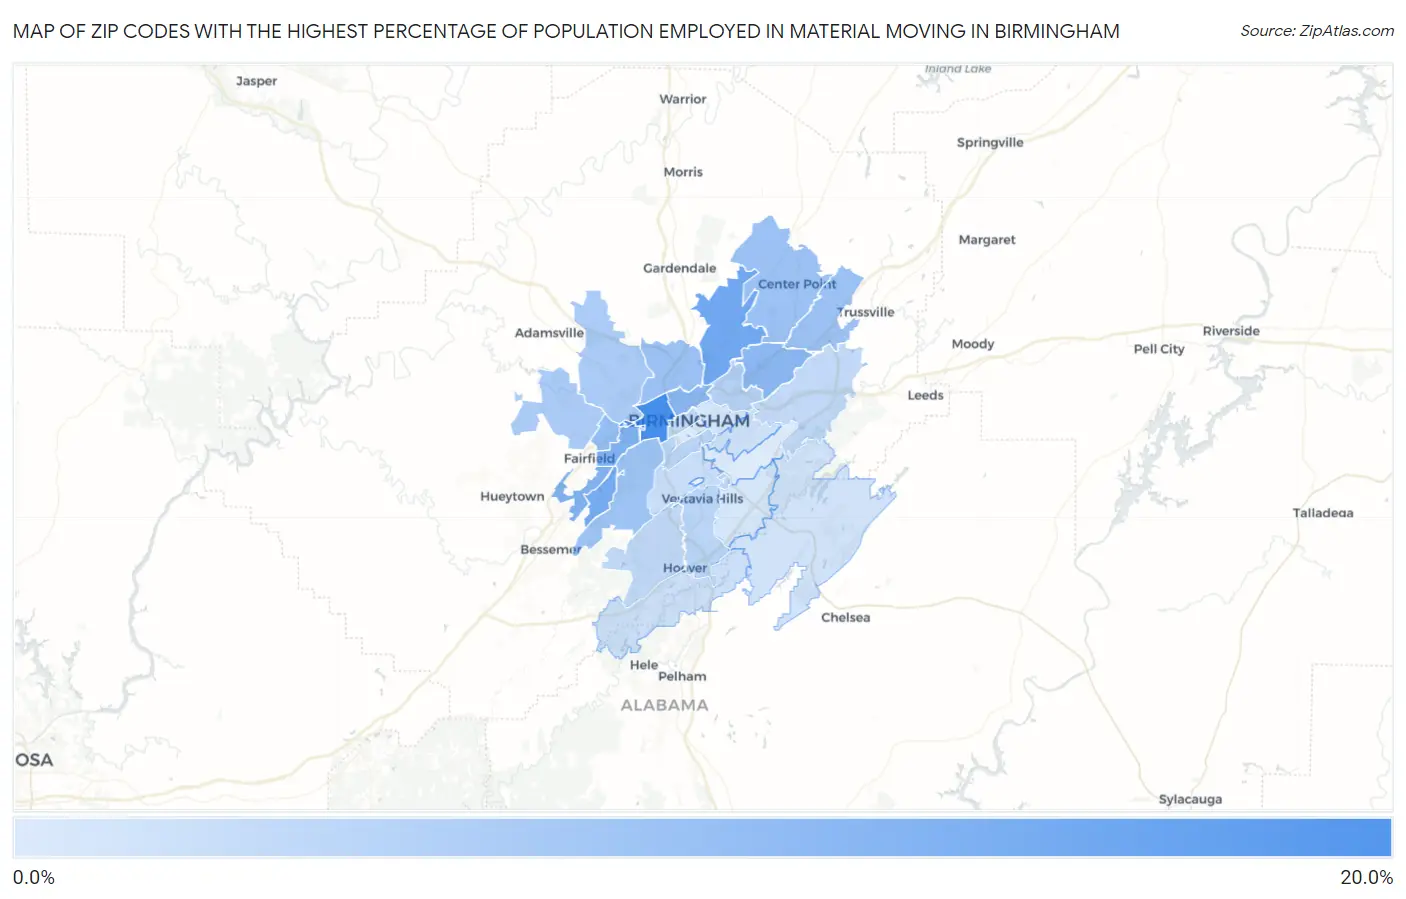
Map of Zip Codes with the Highest Percentage of Population Employed in Material Moving in Birmingham
0.18%
17.2%
Zip Codes with the Highest Percentage of Population Employed in Material Moving in Birmingham, AL
| Zip Code | % Employed | vs State | vs National | |
| 1. | 35204 | 17.2% | 4.6%(+12.6)#15 | 3.8%(+13.4)#596 |
| 2. | 35217 | 12.2% | 4.6%(+7.57)#38 | 3.8%(+8.36)#1,344 |
| 3. | 35221 | 11.4% | 4.6%(+6.83)#42 | 3.8%(+7.61)#1,581 |
| 4. | 35208 | 10.4% | 4.6%(+5.81)#52 | 3.8%(+6.60)#1,984 |
| 5. | 35228 | 10.1% | 4.6%(+5.51)#57 | 3.8%(+6.30)#2,116 |
| 6. | 35234 | 9.0% | 4.6%(+4.36)#82 | 3.8%(+5.15)#2,877 |
| 7. | 35206 | 8.9% | 4.6%(+4.26)#85 | 3.8%(+5.05)#2,961 |
| 8. | 35218 | 7.8% | 4.6%(+3.22)#116 | 3.8%(+4.00)#3,960 |
| 9. | 35207 | 7.5% | 4.6%(+2.89)#131 | 3.8%(+3.68)#4,335 |
| 10. | 35235 | 7.5% | 4.6%(+2.89)#132 | 3.8%(+3.67)#4,350 |
| 11. | 35215 | 7.2% | 4.6%(+2.57)#143 | 3.8%(+3.36)#4,785 |
| 12. | 35211 | 7.0% | 4.6%(+2.39)#148 | 3.8%(+3.17)#5,043 |
| 13. | 35224 | 5.6% | 4.6%(+1.03)#206 | 3.8%(+1.82)#7,757 |
| 14. | 35214 | 5.6% | 4.6%(+0.960)#212 | 3.8%(+1.74)#7,935 |
| 15. | 35212 | 4.3% | 4.6%(-0.337)#301 | 3.8%(+0.448)#11,919 |
| 16. | 35216 | 3.8% | 4.6%(-0.825)#347 | 3.8%(-0.040)#13,757 |
| 17. | 35205 | 3.8% | 4.6%(-0.864)#351 | 3.8%(-0.078)#13,906 |
| 18. | 35210 | 3.1% | 4.6%(-1.47)#392 | 3.8%(-0.689)#16,379 |
| 19. | 35226 | 3.0% | 4.6%(-1.59)#404 | 3.8%(-0.805)#16,865 |
| 20. | 35203 | 2.9% | 4.6%(-1.77)#413 | 3.8%(-0.980)#17,654 |
| 21. | 35209 | 2.3% | 4.6%(-2.35)#447 | 3.8%(-1.57)#20,249 |
| 22. | 35244 | 1.9% | 4.6%(-2.67)#473 | 3.8%(-1.89)#21,667 |
| 23. | 35213 | 1.8% | 4.6%(-2.87)#485 | 3.8%(-2.08)#22,474 |
| 24. | 35254 | 1.5% | 4.6%(-3.15)#501 | 3.8%(-2.37)#23,608 |
| 25. | 35242 | 1.3% | 4.6%(-3.31)#508 | 3.8%(-2.52)#24,195 |
| 26. | 35222 | 1.0% | 4.6%(-3.61)#521 | 3.8%(-2.82)#25,254 |
| 27. | 35243 | 0.82% | 4.6%(-3.80)#528 | 3.8%(-3.01)#25,859 |
| 28. | 35233 | 0.20% | 4.6%(-4.42)#542 | 3.8%(-3.63)#27,188 |
| 29. | 35223 | 0.18% | 4.6%(-4.44)#544 | 3.8%(-3.65)#27,214 |
1
Common Questions
What are the Top 10 Zip Codes with the Highest Percentage of Population Employed in Material Moving in Birmingham, AL?
Top 10 Zip Codes with the Highest Percentage of Population Employed in Material Moving in Birmingham, AL are:
What zip code has the Highest Percentage of Population Employed in Material Moving in Birmingham, AL?
35204 has the Highest Percentage of Population Employed in Material Moving in Birmingham, AL with 17.2%.
What is the Percentage of Population Employed in Material Moving in Birmingham, AL?
Percentage of Population Employed in Material Moving in Birmingham is 6.5%.
What is the Percentage of Population Employed in Material Moving in Alabama?
Percentage of Population Employed in Material Moving in Alabama is 4.6%.
What is the Percentage of Population Employed in Material Moving in the United States?
Percentage of Population Employed in Material Moving in the United States is 3.8%.