Zip Codes with the Highest Percentage of Self-Employed / Not Incorporated in Birmingham, AL
RELATED REPORTS & OPTIONS
Self-Employed / Not Incorporated
Birmingham
Compare Zip Codes
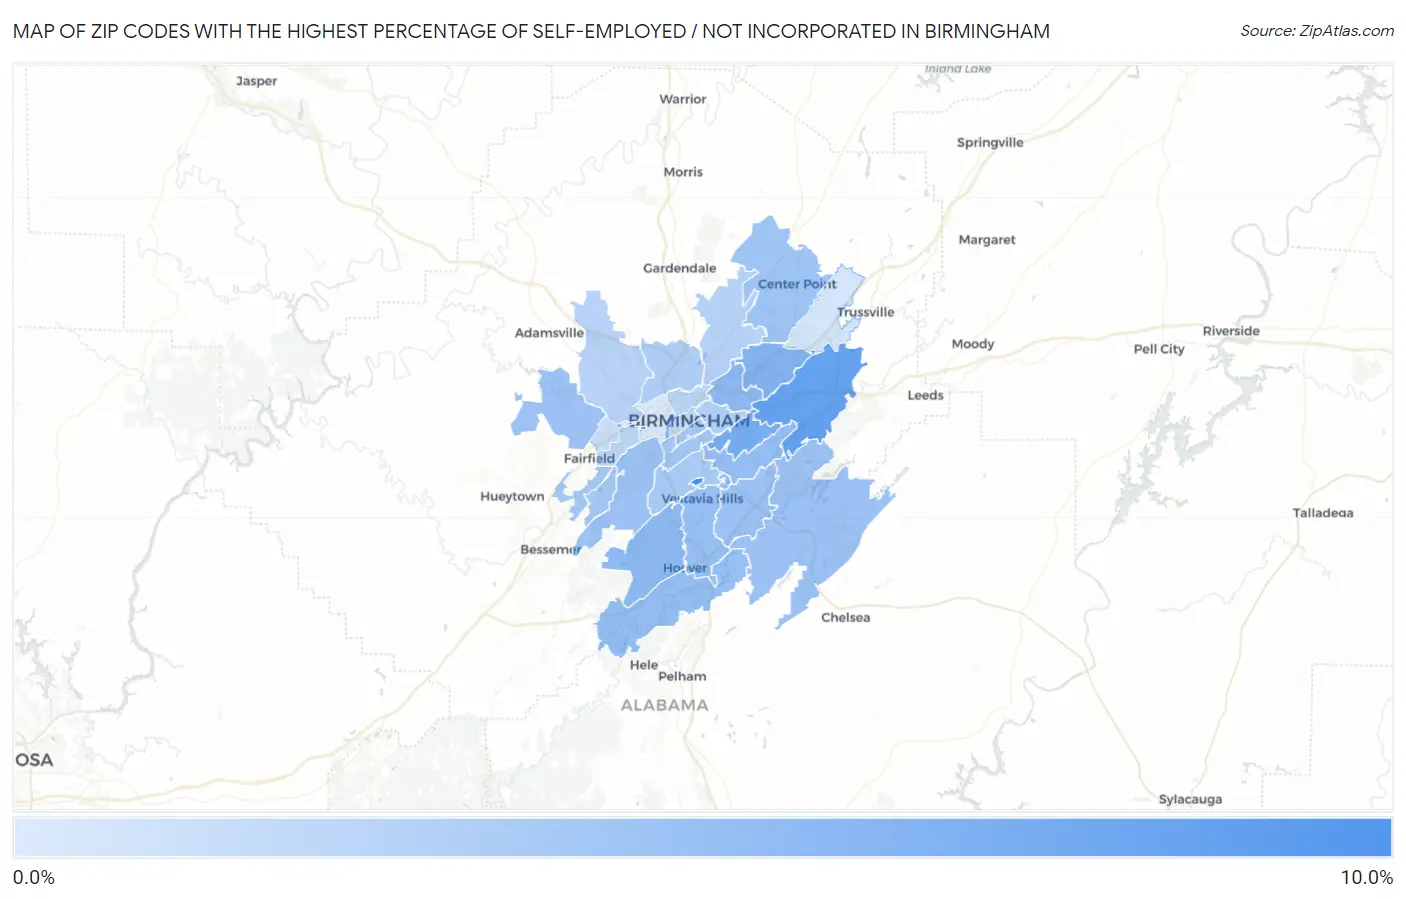
Map of Zip Codes with the Highest Percentage of Self-Employed / Not Incorporated in Birmingham
0.0%
10.0%
Zip Codes with the Highest Percentage of Self-Employed / Not Incorporated in Birmingham, AL
| Zip Code | % Self-Employed / Not Incorporated | vs State | vs National | |
| 1. | 35229 | 8.6% | 5.3%(+3.29)#103 | 5.8%(+2.81)#9,421 |
| 2. | 35254 | 7.1% | 5.3%(+1.78)#162 | 5.8%(+1.30)#12,724 |
| 3. | 35210 | 7.0% | 5.3%(+1.71)#167 | 5.8%(+1.23)#12,925 |
| 4. | 35213 | 6.1% | 5.3%(+0.748)#228 | 5.8%(+0.268)#15,782 |
| 5. | 35206 | 5.5% | 5.3%(+0.186)#260 | 5.8%(-0.293)#17,694 |
| 6. | 35226 | 4.9% | 5.3%(-0.414)#315 | 5.8%(-0.893)#19,978 |
| 7. | 35212 | 4.9% | 5.3%(-0.484)#318 | 5.8%(-0.963)#20,216 |
| 8. | 35223 | 4.6% | 5.3%(-0.702)#343 | 5.8%(-1.18)#21,039 |
| 9. | 35244 | 4.6% | 5.3%(-0.757)#348 | 5.8%(-1.24)#21,237 |
| 10. | 35216 | 4.4% | 5.3%(-0.938)#360 | 5.8%(-1.42)#21,957 |
| 11. | 35243 | 4.4% | 5.3%(-0.974)#367 | 5.8%(-1.45)#22,078 |
| 12. | 35211 | 4.3% | 5.3%(-1.01)#370 | 5.8%(-1.49)#22,205 |
| 13. | 35242 | 4.3% | 5.3%(-1.04)#375 | 5.8%(-1.51)#22,314 |
| 14. | 35224 | 4.2% | 5.3%(-1.15)#382 | 5.8%(-1.62)#22,709 |
| 15. | 35215 | 4.0% | 5.3%(-1.31)#399 | 5.8%(-1.79)#23,286 |
| 16. | 35205 | 3.9% | 5.3%(-1.47)#411 | 5.8%(-1.95)#23,840 |
| 17. | 35221 | 3.8% | 5.3%(-1.55)#418 | 5.8%(-2.03)#24,118 |
| 18. | 35233 | 3.7% | 5.3%(-1.62)#421 | 5.8%(-2.10)#24,351 |
| 19. | 35209 | 3.6% | 5.3%(-1.72)#430 | 5.8%(-2.20)#24,671 |
| 20. | 35228 | 3.6% | 5.3%(-1.74)#432 | 5.8%(-2.22)#24,735 |
| 21. | 35207 | 3.3% | 5.3%(-2.07)#443 | 5.8%(-2.55)#25,682 |
| 22. | 35222 | 3.1% | 5.3%(-2.24)#458 | 5.8%(-2.72)#26,126 |
| 23. | 35217 | 3.0% | 5.3%(-2.38)#465 | 5.8%(-2.86)#26,489 |
| 24. | 35214 | 2.8% | 5.3%(-2.50)#471 | 5.8%(-2.98)#26,747 |
| 25. | 35208 | 2.6% | 5.3%(-2.72)#484 | 5.8%(-3.20)#27,211 |
| 26. | 35234 | 2.6% | 5.3%(-2.76)#485 | 5.8%(-3.24)#27,287 |
| 27. | 35203 | 2.1% | 5.3%(-3.20)#500 | 5.8%(-3.68)#28,045 |
| 28. | 35218 | 1.9% | 5.3%(-3.47)#515 | 5.8%(-3.95)#28,408 |
| 29. | 35235 | 1.4% | 5.3%(-3.90)#525 | 5.8%(-4.38)#28,797 |
| 30. | 35204 | 0.98% | 5.3%(-4.36)#535 | 5.8%(-4.84)#29,138 |
1
Common Questions
What are the Top 10 Zip Codes with the Highest Percentage of Self-Employed / Not Incorporated in Birmingham, AL?
Top 10 Zip Codes with the Highest Percentage of Self-Employed / Not Incorporated in Birmingham, AL are:
What zip code has the Highest Percentage of Self-Employed / Not Incorporated in Birmingham, AL?
35229 has the Highest Percentage of Self-Employed / Not Incorporated in Birmingham, AL with 8.6%.
What is the Percentage of Self-Employed / Not Incorporated in Birmingham, AL?
Percentage of Self-Employed / Not Incorporated in Birmingham is 3.6%.
What is the Percentage of Self-Employed / Not Incorporated in Alabama?
Percentage of Self-Employed / Not Incorporated in Alabama is 5.3%.
What is the Percentage of Self-Employed / Not Incorporated in the United States?
Percentage of Self-Employed / Not Incorporated in the United States is 5.8%.