Zip Codes with the Highest Percentage of Population Employed in Food Preparation & Serving in Prattville, AL
RELATED REPORTS & OPTIONS
Food Preparation & Serving
Prattville
Compare Zip Codes
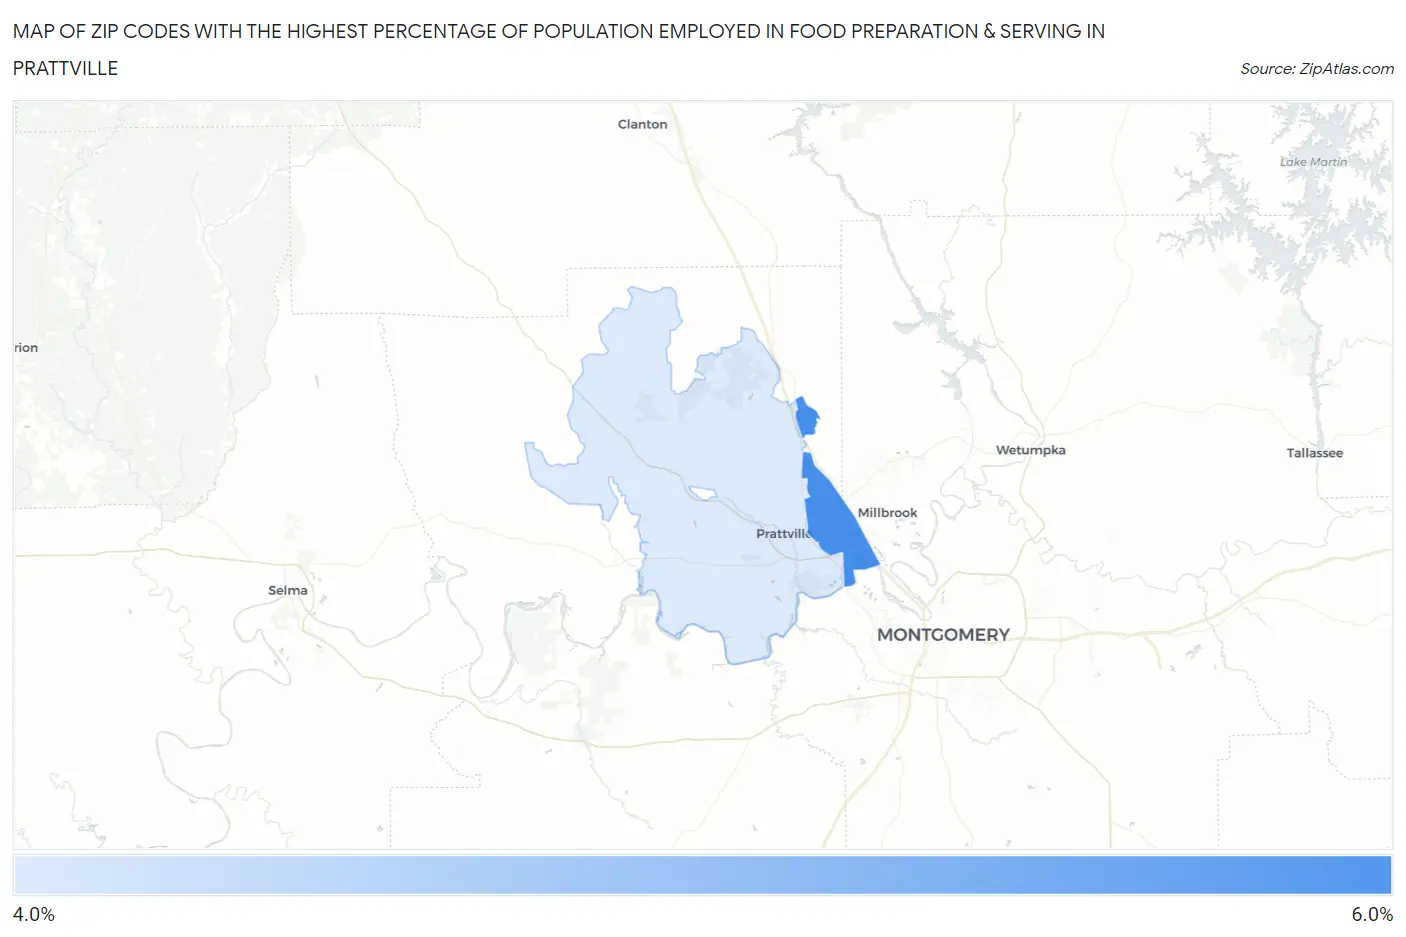
Map of Zip Codes with the Highest Percentage of Population Employed in Food Preparation & Serving in Prattville
5.0%
5.9%
Zip Codes with the Highest Percentage of Population Employed in Food Preparation & Serving in Prattville, AL
| Zip Code | % Employed | vs State | vs National | |
| 1. | 36066 | 5.9% | 5.2%(+0.726)#182 | 5.3%(+0.640)#9,587 |
| 2. | 36067 | 5.0% | 5.2%(-0.244)#252 | 5.3%(-0.330)#13,126 |
1
Common Questions
What are the Top Zip Codes with the Highest Percentage of Population Employed in Food Preparation & Serving in Prattville, AL?
Top Zip Codes with the Highest Percentage of Population Employed in Food Preparation & Serving in Prattville, AL are:
What zip code has the Highest Percentage of Population Employed in Food Preparation & Serving in Prattville, AL?
36066 has the Highest Percentage of Population Employed in Food Preparation & Serving in Prattville, AL with 5.9%.
What is the Percentage of Population Employed in Food Preparation & Serving in Prattville, AL?
Percentage of Population Employed in Food Preparation & Serving in Prattville is 5.4%.
What is the Percentage of Population Employed in Food Preparation & Serving in Alabama?
Percentage of Population Employed in Food Preparation & Serving in Alabama is 5.2%.
What is the Percentage of Population Employed in Food Preparation & Serving in the United States?
Percentage of Population Employed in Food Preparation & Serving in the United States is 5.3%.