Zip Codes with the Highest Percentage of Not-for-profit Organizations in Birmingham, AL
RELATED REPORTS & OPTIONS
Not-for-profit Organizations
Birmingham
Compare Zip Codes
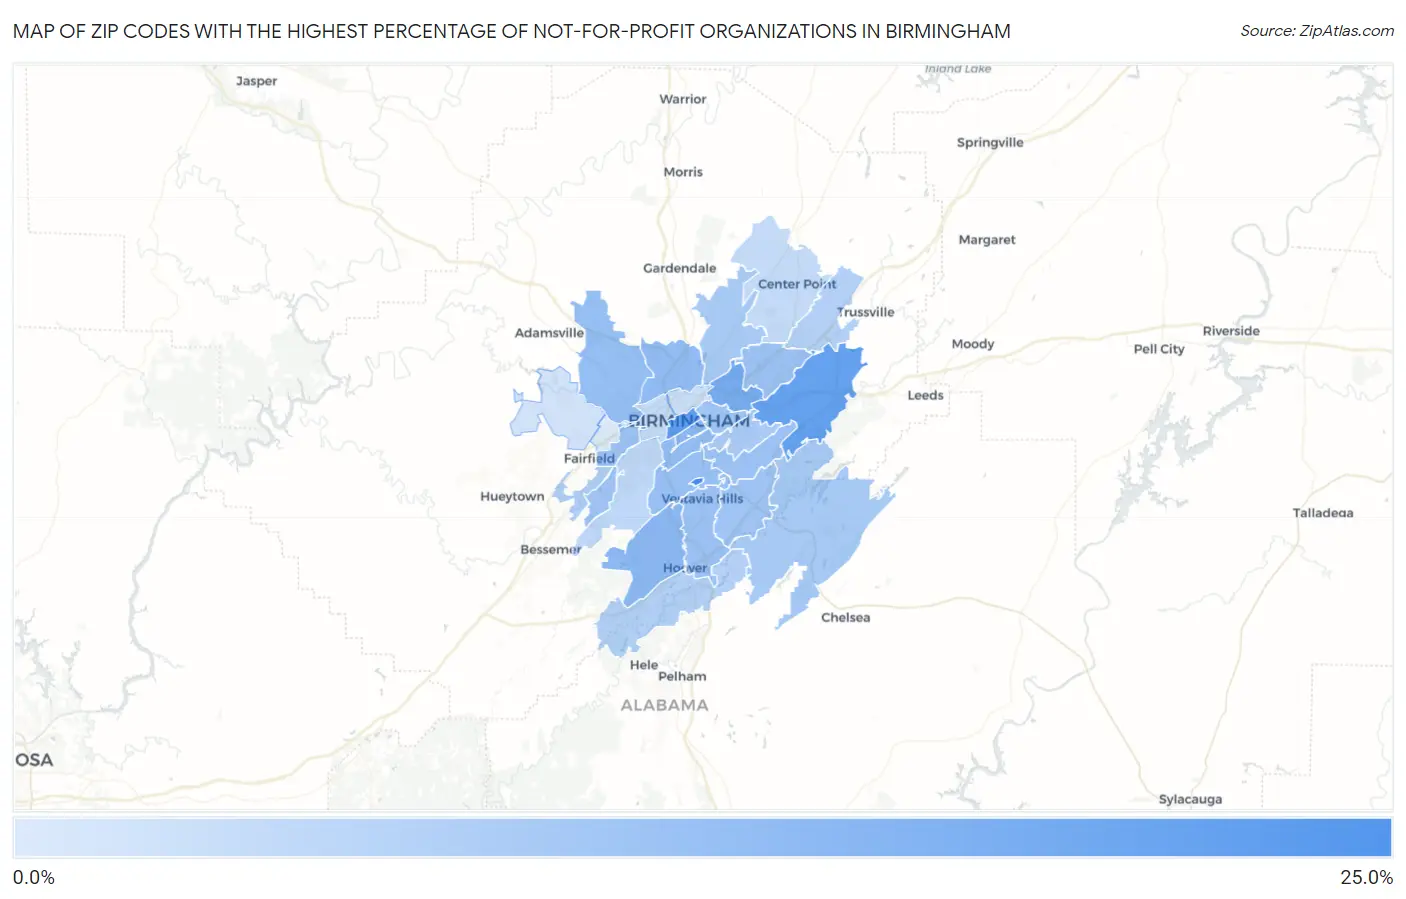
Map of Zip Codes with the Highest Percentage of Not-for-profit Organizations in Birmingham
3.0%
20.5%
Zip Codes with the Highest Percentage of Not-for-profit Organizations in Birmingham, AL
| Zip Code | % Employed in Not-for-profit | vs State | vs National | |
| 1. | 35229 | 20.5% | 6.7%(+13.8)#11 | 8.4%(+12.0)#1,220 |
| 2. | 35203 | 17.3% | 6.7%(+10.6)#18 | 8.4%(+8.89)#1,922 |
| 3. | 35210 | 16.6% | 6.7%(+9.94)#19 | 8.4%(+8.20)#2,175 |
| 4. | 35212 | 14.5% | 6.7%(+7.77)#30 | 8.4%(+6.04)#3,249 |
| 5. | 35233 | 12.4% | 6.7%(+5.65)#42 | 8.4%(+3.91)#5,195 |
| 6. | 35254 | 12.1% | 6.7%(+5.43)#44 | 8.4%(+3.69)#5,465 |
| 7. | 35226 | 12.1% | 6.7%(+5.37)#45 | 8.4%(+3.64)#5,542 |
| 8. | 35207 | 11.4% | 6.7%(+4.74)#52 | 8.4%(+3.00)#6,388 |
| 9. | 35205 | 11.4% | 6.7%(+4.68)#55 | 8.4%(+2.94)#6,469 |
| 10. | 35214 | 10.9% | 6.7%(+4.21)#63 | 8.4%(+2.47)#7,196 |
| 11. | 35209 | 10.7% | 6.7%(+4.03)#66 | 8.4%(+2.29)#7,499 |
| 12. | 35223 | 10.5% | 6.7%(+3.80)#71 | 8.4%(+2.06)#7,898 |
| 13. | 35216 | 10.5% | 6.7%(+3.78)#73 | 8.4%(+2.04)#7,933 |
| 14. | 35208 | 10.2% | 6.7%(+3.47)#81 | 8.4%(+1.73)#8,556 |
| 15. | 35206 | 10.1% | 6.7%(+3.44)#83 | 8.4%(+1.70)#8,624 |
| 16. | 35222 | 9.7% | 6.7%(+2.99)#91 | 8.4%(+1.25)#9,540 |
| 17. | 35221 | 9.7% | 6.7%(+2.98)#92 | 8.4%(+1.24)#9,546 |
| 18. | 35243 | 9.6% | 6.7%(+2.90)#97 | 8.4%(+1.16)#9,718 |
| 19. | 35242 | 9.0% | 6.7%(+2.27)#118 | 8.4%(+0.535)#11,111 |
| 20. | 35217 | 8.8% | 6.7%(+2.09)#123 | 8.4%(+0.355)#11,565 |
| 21. | 35213 | 8.6% | 6.7%(+1.84)#129 | 8.4%(+0.106)#12,152 |
| 22. | 35228 | 7.8% | 6.7%(+1.06)#156 | 8.4%(-0.681)#14,288 |
| 23. | 35244 | 7.6% | 6.7%(+0.913)#163 | 8.4%(-0.826)#14,709 |
| 24. | 35235 | 7.5% | 6.7%(+0.752)#174 | 8.4%(-0.986)#15,204 |
| 25. | 35211 | 6.4% | 6.7%(-0.307)#236 | 8.4%(-2.05)#18,325 |
| 26. | 35215 | 5.9% | 6.7%(-0.855)#275 | 8.4%(-2.59)#19,900 |
| 27. | 35204 | 5.6% | 6.7%(-1.15)#297 | 8.4%(-2.89)#20,763 |
| 28. | 35234 | 4.8% | 6.7%(-1.92)#348 | 8.4%(-3.66)#22,878 |
| 29. | 35224 | 4.2% | 6.7%(-2.46)#386 | 8.4%(-4.20)#24,152 |
| 30. | 35218 | 3.0% | 6.7%(-3.70)#466 | 8.4%(-5.43)#26,610 |
1
Common Questions
What are the Top 10 Zip Codes with the Highest Percentage of Not-for-profit Organizations in Birmingham, AL?
Top 10 Zip Codes with the Highest Percentage of Not-for-profit Organizations in Birmingham, AL are:
What zip code has the Highest Percentage of Not-for-profit Organizations in Birmingham, AL?
35229 has the Highest Percentage of Not-for-profit Organizations in Birmingham, AL with 20.5%.
What is the Percentage of Not-for-profit Organizations in Birmingham, AL?
Percentage of Not-for-profit Organizations in Birmingham is 9.6%.
What is the Percentage of Not-for-profit Organizations in Alabama?
Percentage of Not-for-profit Organizations in Alabama is 6.7%.
What is the Percentage of Not-for-profit Organizations in the United States?
Percentage of Not-for-profit Organizations in the United States is 8.4%.