Zip Codes with the Highest Percentage of Population Employed in Food Preparation & Serving in Tuscaloosa, AL
RELATED REPORTS & OPTIONS
Food Preparation & Serving
Tuscaloosa
Compare Zip Codes
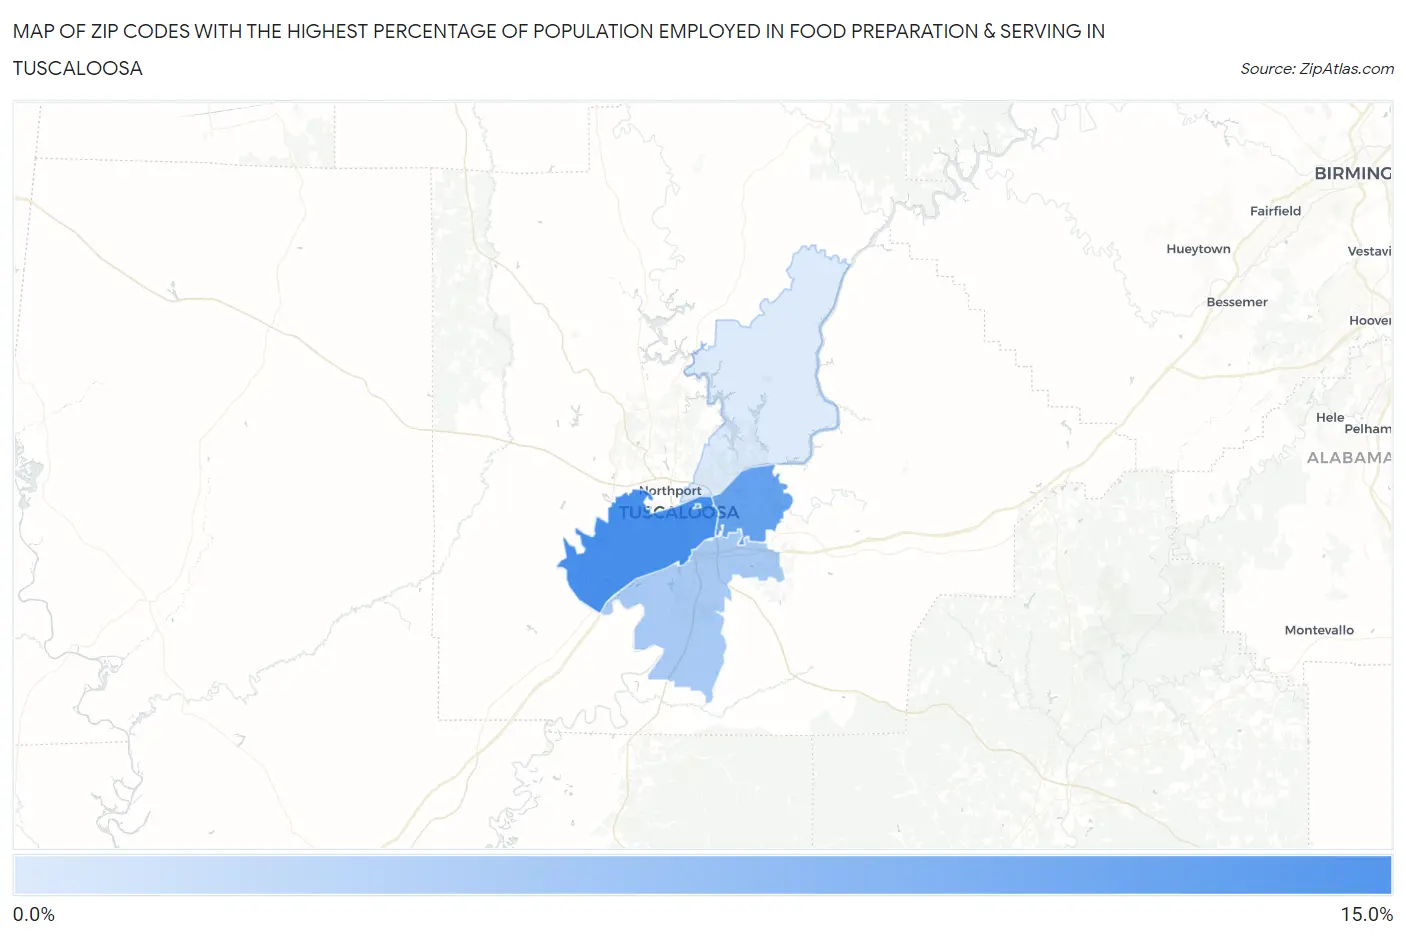
Map of Zip Codes with the Highest Percentage of Population Employed in Food Preparation & Serving in Tuscaloosa
2.2%
11.3%
Zip Codes with the Highest Percentage of Population Employed in Food Preparation & Serving in Tuscaloosa, AL
| Zip Code | % Employed | vs State | vs National | |
| 1. | 35401 | 11.3% | 5.2%(+6.10)#35 | 5.3%(+6.01)#1,919 |
| 2. | 35404 | 9.4% | 5.2%(+4.24)#59 | 5.3%(+4.15)#3,104 |
| 3. | 35487 | 8.7% | 5.2%(+3.52)#76 | 5.3%(+3.43)#3,822 |
| 4. | 35405 | 5.3% | 5.2%(+0.076)#233 | 5.3%(-0.010)#11,851 |
| 5. | 35406 | 2.2% | 5.2%(-3.04)#441 | 5.3%(-3.12)#24,225 |
1
Common Questions
What are the Top 3 Zip Codes with the Highest Percentage of Population Employed in Food Preparation & Serving in Tuscaloosa, AL?
Top 3 Zip Codes with the Highest Percentage of Population Employed in Food Preparation & Serving in Tuscaloosa, AL are:
What zip code has the Highest Percentage of Population Employed in Food Preparation & Serving in Tuscaloosa, AL?
35401 has the Highest Percentage of Population Employed in Food Preparation & Serving in Tuscaloosa, AL with 11.3%.
What is the Percentage of Population Employed in Food Preparation & Serving in Tuscaloosa, AL?
Percentage of Population Employed in Food Preparation & Serving in Tuscaloosa is 7.4%.
What is the Percentage of Population Employed in Food Preparation & Serving in Alabama?
Percentage of Population Employed in Food Preparation & Serving in Alabama is 5.2%.
What is the Percentage of Population Employed in Food Preparation & Serving in the United States?
Percentage of Population Employed in Food Preparation & Serving in the United States is 5.3%.