Zip Codes with the Highest Percentage of Population Employed in Food Preparation & Serving in Opelika, AL
RELATED REPORTS & OPTIONS
Food Preparation & Serving
Opelika
Compare Zip Codes
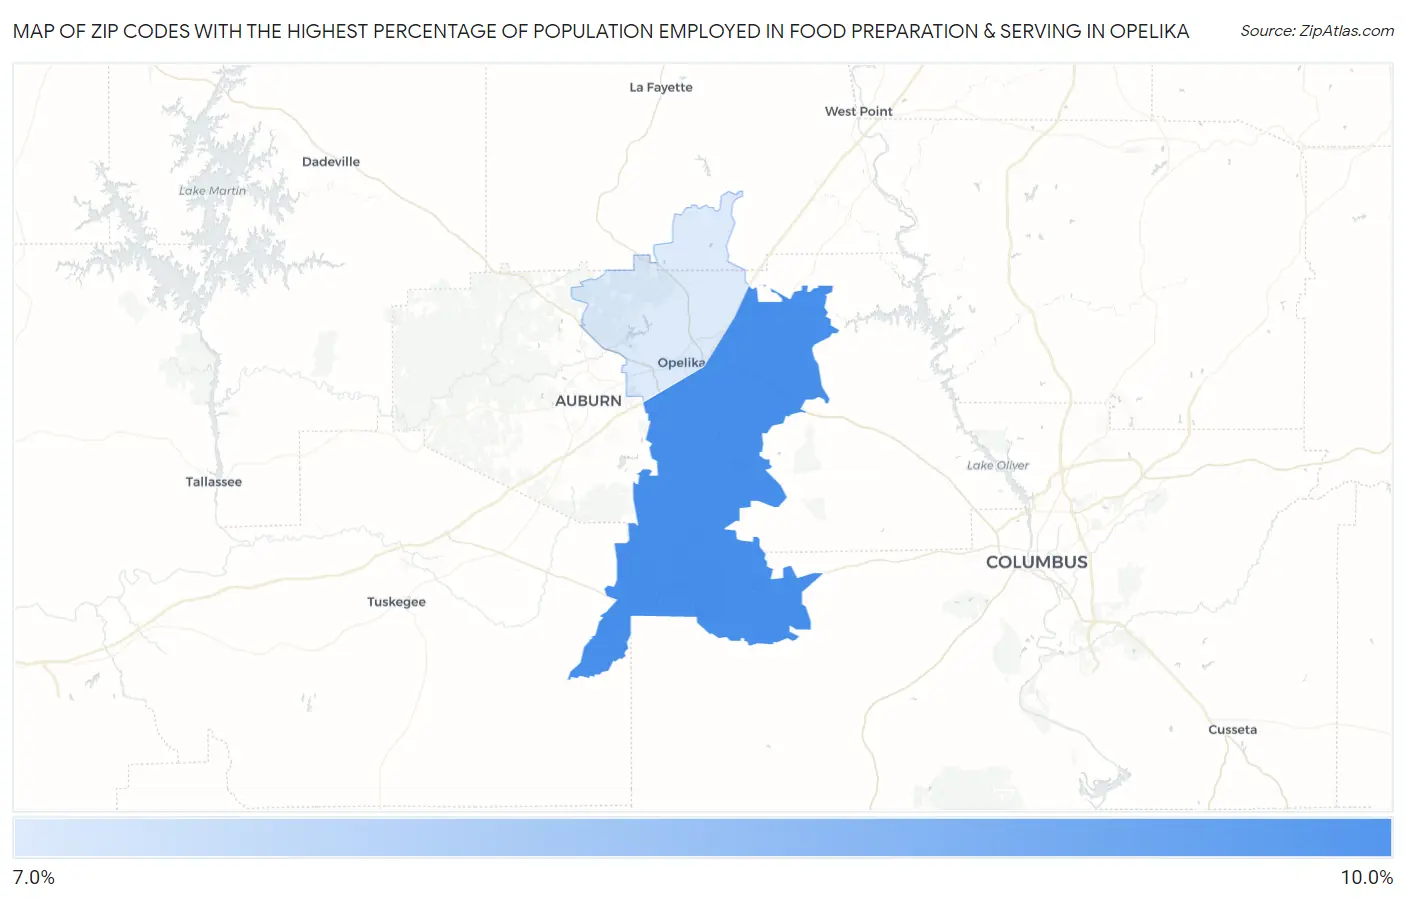
Map of Zip Codes with the Highest Percentage of Population Employed in Food Preparation & Serving in Opelika
7.6%
8.8%
Zip Codes with the Highest Percentage of Population Employed in Food Preparation & Serving in Opelika, AL
| Zip Code | % Employed | vs State | vs National | |
| 1. | 36804 | 8.8% | 5.2%(+3.58)#75 | 5.3%(+3.49)#3,753 |
| 2. | 36801 | 7.6% | 5.2%(+2.36)#110 | 5.3%(+2.28)#5,443 |
1
Common Questions
What are the Top Zip Codes with the Highest Percentage of Population Employed in Food Preparation & Serving in Opelika, AL?
Top Zip Codes with the Highest Percentage of Population Employed in Food Preparation & Serving in Opelika, AL are:
What zip code has the Highest Percentage of Population Employed in Food Preparation & Serving in Opelika, AL?
36804 has the Highest Percentage of Population Employed in Food Preparation & Serving in Opelika, AL with 8.8%.
What is the Percentage of Population Employed in Food Preparation & Serving in Opelika, AL?
Percentage of Population Employed in Food Preparation & Serving in Opelika is 6.4%.
What is the Percentage of Population Employed in Food Preparation & Serving in Alabama?
Percentage of Population Employed in Food Preparation & Serving in Alabama is 5.2%.
What is the Percentage of Population Employed in Food Preparation & Serving in the United States?
Percentage of Population Employed in Food Preparation & Serving in the United States is 5.3%.