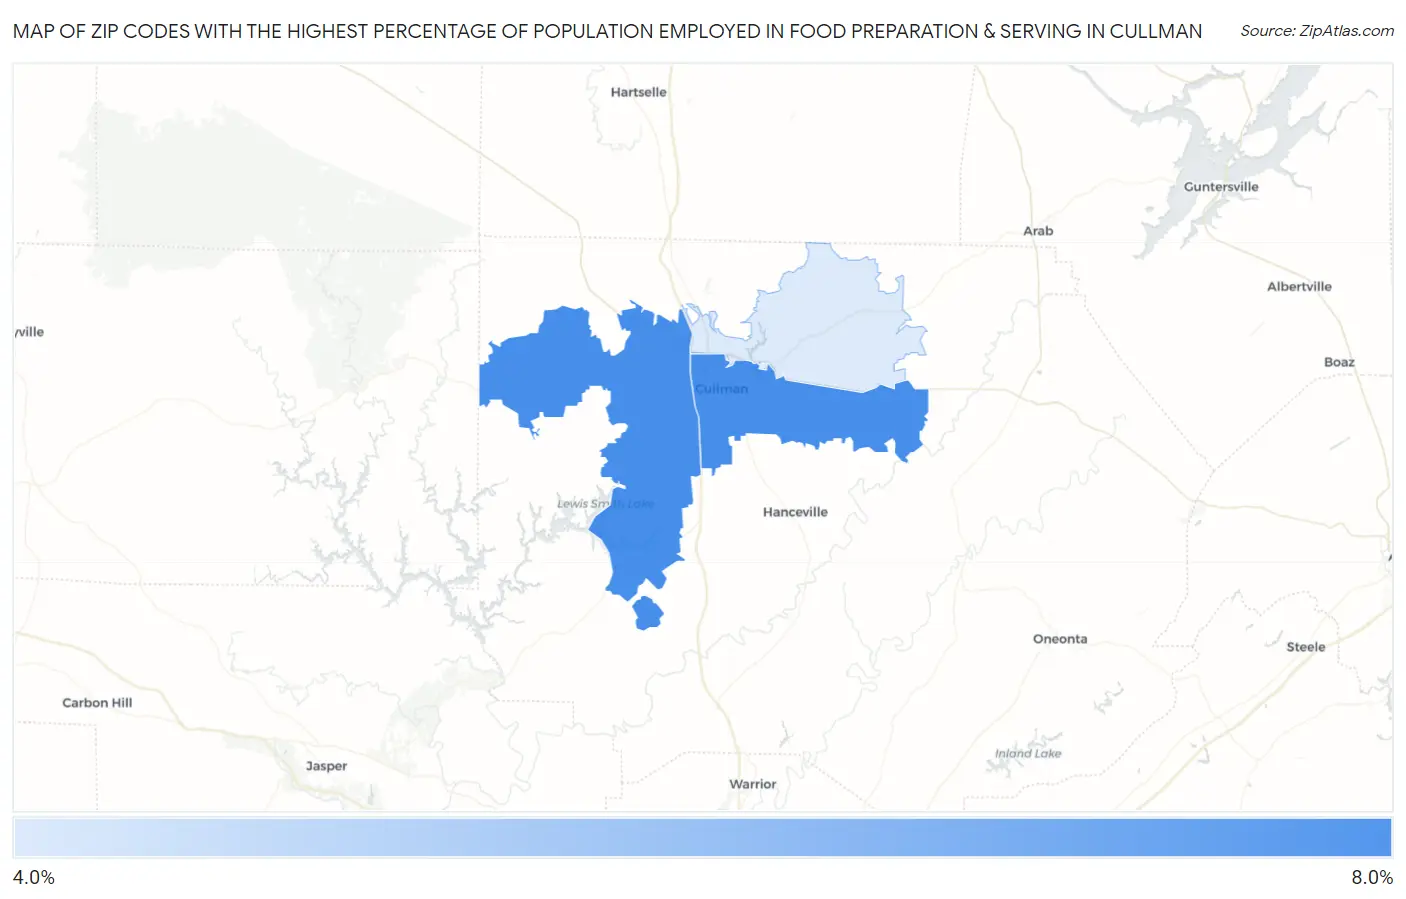
Zip Codes with the Highest Percentage of Population Employed in Food Preparation & Serving in Cullman, AL
RELATED REPORTS & OPTIONS
Food Preparation & Serving
Cullman
Compare Zip Codes
Map of Zip Codes with the Highest Percentage of Population Employed in Food Preparation & Serving in Cullman
4.4%
6.0%
Zip Codes with the Highest Percentage of Population Employed in Food Preparation & Serving in Cullman, AL
| Zip Code | % Employed | vs State | vs National | |
| 1. | 35057 | 6.0% | 5.2%(+0.809)#176 | 5.3%(+0.723)#9,318 |
| 2. | 35055 | 6.0% | 5.2%(+0.804)#177 | 5.3%(+0.718)#9,331 |
| 3. | 35058 | 4.4% | 5.2%(-0.773)#292 | 5.3%(-0.859)#15,305 |
1
Common Questions
What are the Top Zip Codes with the Highest Percentage of Population Employed in Food Preparation & Serving in Cullman, AL?
Top Zip Codes with the Highest Percentage of Population Employed in Food Preparation & Serving in Cullman, AL are:
What zip code has the Highest Percentage of Population Employed in Food Preparation & Serving in Cullman, AL?
35057 has the Highest Percentage of Population Employed in Food Preparation & Serving in Cullman, AL with 6.0%.
What is the Percentage of Population Employed in Food Preparation & Serving in Cullman, AL?
Percentage of Population Employed in Food Preparation & Serving in Cullman is 5.9%.
What is the Percentage of Population Employed in Food Preparation & Serving in Alabama?
Percentage of Population Employed in Food Preparation & Serving in Alabama is 5.2%.
What is the Percentage of Population Employed in Food Preparation & Serving in the United States?
Percentage of Population Employed in Food Preparation & Serving in the United States is 5.3%.