Zip Codes with the Highest Percentage of Population Employed in Food Preparation & Serving in Albertville, AL
RELATED REPORTS & OPTIONS
Food Preparation & Serving
Albertville
Compare Zip Codes
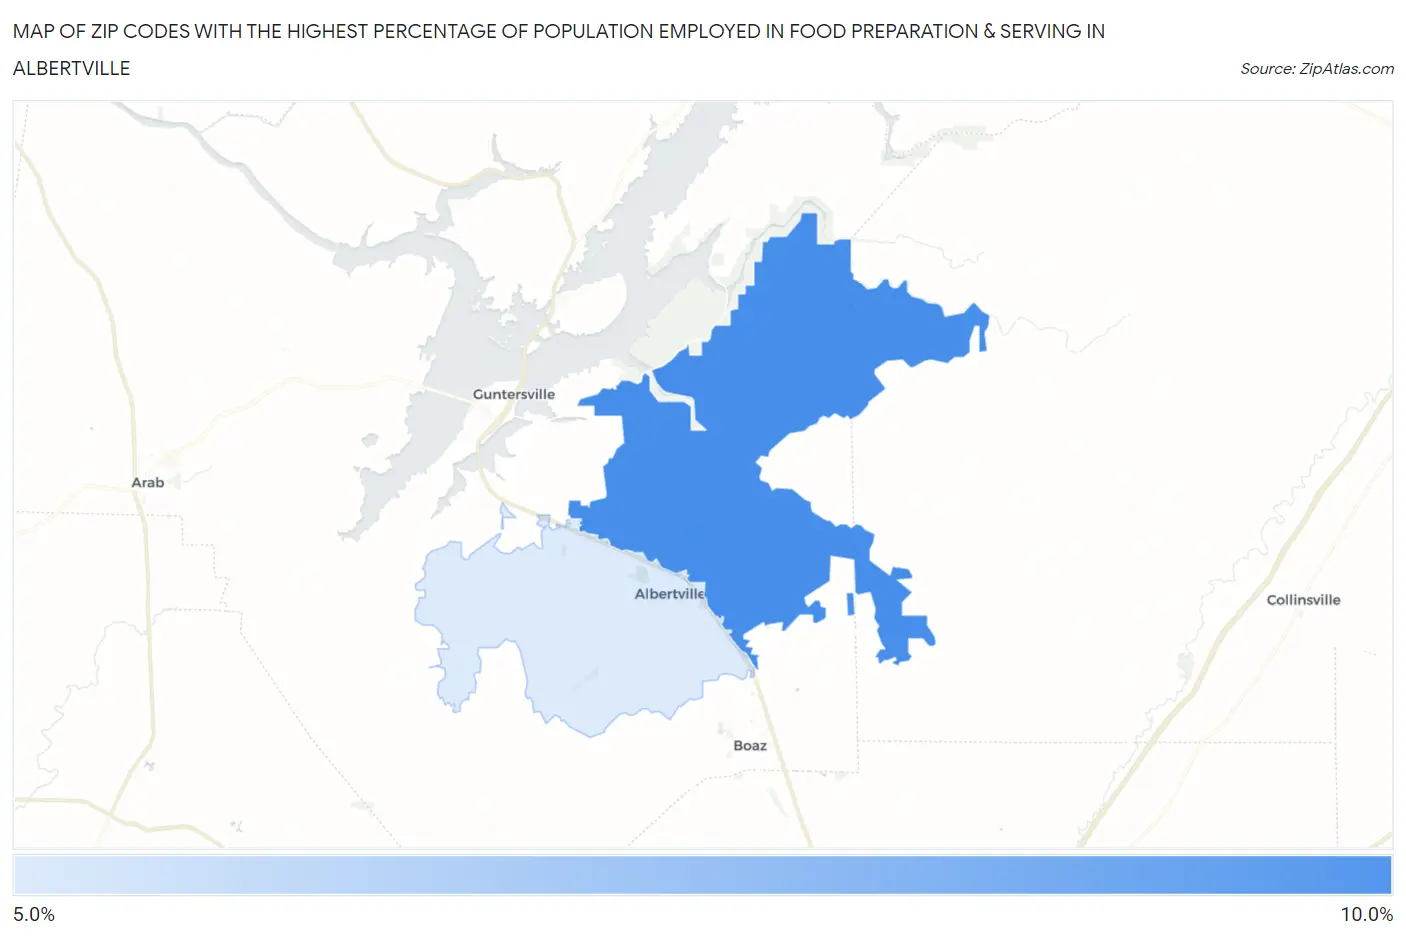
Map of Zip Codes with the Highest Percentage of Population Employed in Food Preparation & Serving in Albertville
5.3%
8.2%
Zip Codes with the Highest Percentage of Population Employed in Food Preparation & Serving in Albertville, AL
| Zip Code | % Employed | vs State | vs National | |
| 1. | 35951 | 8.2% | 5.2%(+3.03)#88 | 5.3%(+2.94)#4,399 |
| 2. | 35950 | 5.3% | 5.2%(+0.084)#232 | 5.3%(-0.002)#11,827 |
1
Common Questions
What are the Top Zip Codes with the Highest Percentage of Population Employed in Food Preparation & Serving in Albertville, AL?
Top Zip Codes with the Highest Percentage of Population Employed in Food Preparation & Serving in Albertville, AL are:
What zip code has the Highest Percentage of Population Employed in Food Preparation & Serving in Albertville, AL?
35951 has the Highest Percentage of Population Employed in Food Preparation & Serving in Albertville, AL with 8.2%.
What is the Percentage of Population Employed in Food Preparation & Serving in Albertville, AL?
Percentage of Population Employed in Food Preparation & Serving in Albertville is 5.9%.
What is the Percentage of Population Employed in Food Preparation & Serving in Alabama?
Percentage of Population Employed in Food Preparation & Serving in Alabama is 5.2%.
What is the Percentage of Population Employed in Food Preparation & Serving in the United States?
Percentage of Population Employed in Food Preparation & Serving in the United States is 5.3%.