Zip Codes with the Highest Percentage of Population Employed in Agriculture, Fishing & Hunting in Redmond, WA
RELATED REPORTS & OPTIONS
Agriculture, Fishing & Hunting
Redmond
Compare Zip Codes
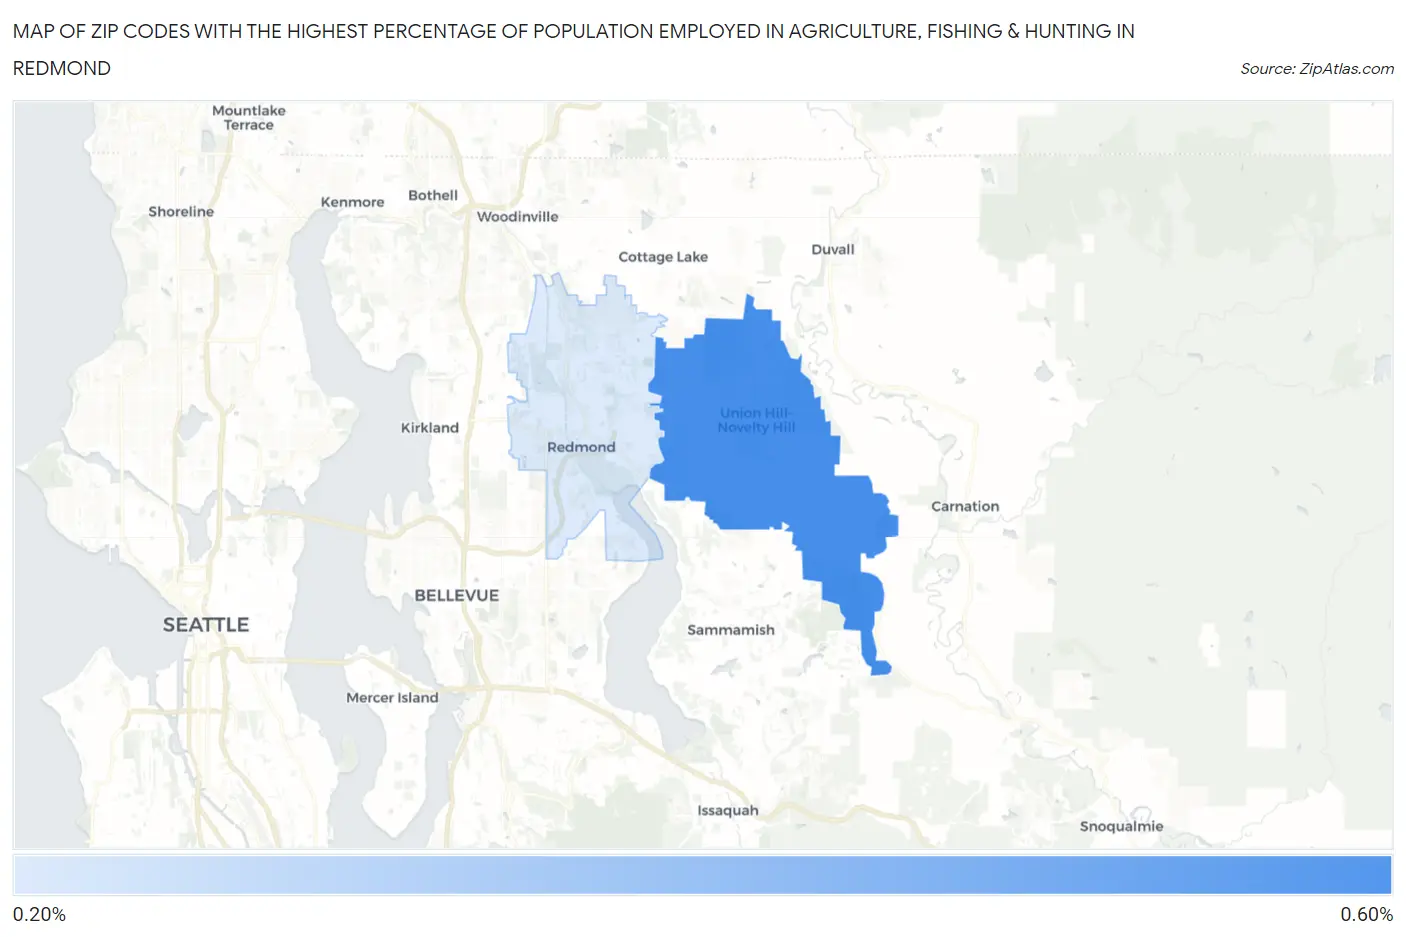
Map of Zip Codes with the Highest Percentage of Population Employed in Agriculture, Fishing & Hunting in Redmond
0.23%
0.59%
Zip Codes with the Highest Percentage of Population Employed in Agriculture, Fishing & Hunting in Redmond, WA
| Zip Code | % Employed | vs State | vs National | |
| 1. | 98053 | 0.59% | 2.4%(-1.80)#393 | 1.2%(-0.609)#18,548 |
| 2. | 98052 | 0.23% | 2.4%(-2.16)#470 | 1.2%(-0.972)#22,007 |
1
Common Questions
What are the Top Zip Codes with the Highest Percentage of Population Employed in Agriculture, Fishing & Hunting in Redmond, WA?
Top Zip Codes with the Highest Percentage of Population Employed in Agriculture, Fishing & Hunting in Redmond, WA are:
What zip code has the Highest Percentage of Population Employed in Agriculture, Fishing & Hunting in Redmond, WA?
98053 has the Highest Percentage of Population Employed in Agriculture, Fishing & Hunting in Redmond, WA with 0.59%.
What is the Percentage of Population Employed in Agriculture, Fishing & Hunting in Redmond, WA?
Percentage of Population Employed in Agriculture, Fishing & Hunting in Redmond is 0.063%.
What is the Percentage of Population Employed in Agriculture, Fishing & Hunting in Washington?
Percentage of Population Employed in Agriculture, Fishing & Hunting in Washington is 2.4%.
What is the Percentage of Population Employed in Agriculture, Fishing & Hunting in the United States?
Percentage of Population Employed in Agriculture, Fishing & Hunting in the United States is 1.2%.