Zip Codes with the Highest Percentage of Population Employed in Transportation & Warehousing in Marysville, WA
RELATED REPORTS & OPTIONS
Transportation & Warehousing
Marysville
Compare Zip Codes
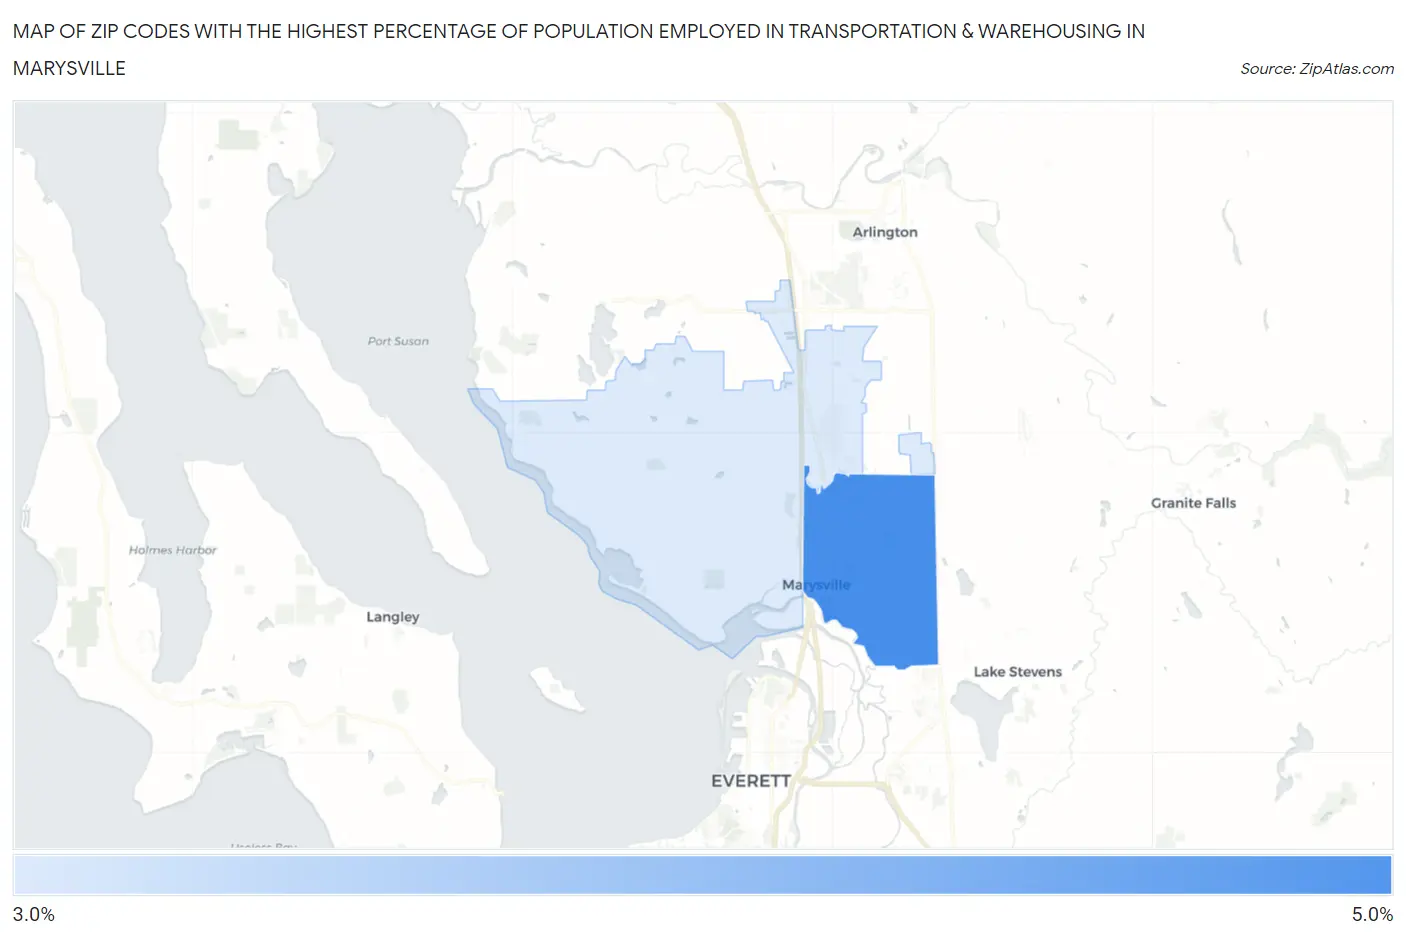
Map of Zip Codes with the Highest Percentage of Population Employed in Transportation & Warehousing in Marysville
3.5%
4.5%
Zip Codes with the Highest Percentage of Population Employed in Transportation & Warehousing in Marysville, WA
| Zip Code | % Employed | vs State | vs National | |
| 1. | 98270 | 4.5% | 4.9%(-0.386)#241 | 4.9%(-0.418)#13,699 |
| 2. | 98271 | 3.5% | 4.9%(-1.46)#322 | 4.9%(-1.49)#18,266 |
1
Common Questions
What are the Top Zip Codes with the Highest Percentage of Population Employed in Transportation & Warehousing in Marysville, WA?
Top Zip Codes with the Highest Percentage of Population Employed in Transportation & Warehousing in Marysville, WA are:
What zip code has the Highest Percentage of Population Employed in Transportation & Warehousing in Marysville, WA?
98270 has the Highest Percentage of Population Employed in Transportation & Warehousing in Marysville, WA with 4.5%.
What is the Percentage of Population Employed in Transportation & Warehousing in Marysville, WA?
Percentage of Population Employed in Transportation & Warehousing in Marysville is 4.1%.
What is the Percentage of Population Employed in Transportation & Warehousing in Washington?
Percentage of Population Employed in Transportation & Warehousing in Washington is 4.9%.
What is the Percentage of Population Employed in Transportation & Warehousing in the United States?
Percentage of Population Employed in Transportation & Warehousing in the United States is 4.9%.