Zip Codes with the Highest Percentage of Population Employed in Office & Administration in Marysville, WA
RELATED REPORTS & OPTIONS
Office & Administration
Marysville
Compare Zip Codes
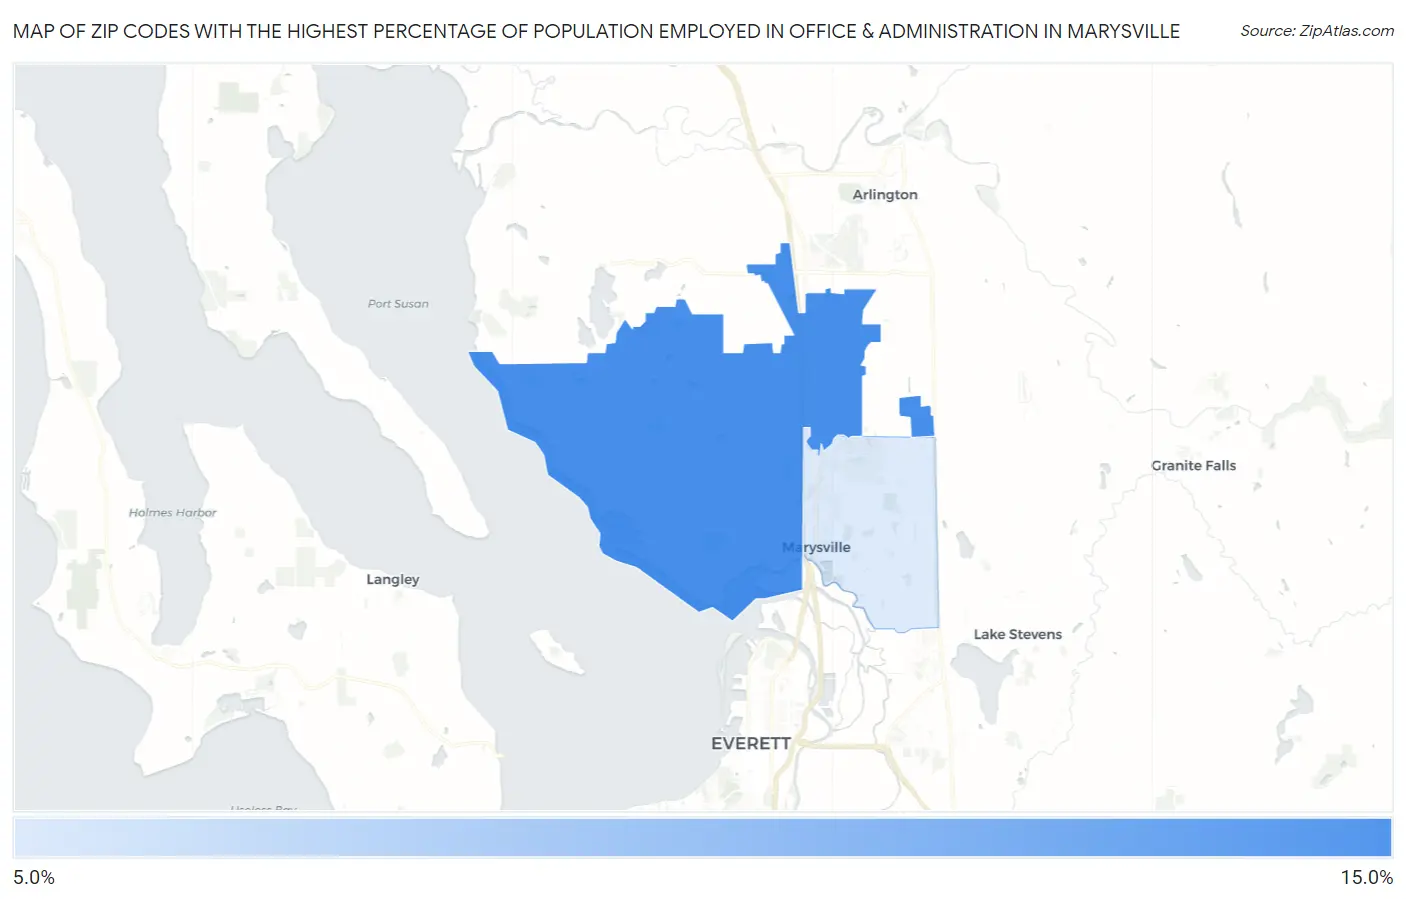
Map of Zip Codes with the Highest Percentage of Population Employed in Office & Administration in Marysville
12.1%
12.6%
Zip Codes with the Highest Percentage of Population Employed in Office & Administration in Marysville, WA
| Zip Code | % Employed | vs State | vs National | |
| 1. | 98271 | 12.6% | 9.8%(+2.76)#127 | 10.9%(+1.69)#9,145 |
| 2. | 98270 | 12.1% | 9.8%(+2.29)#145 | 10.9%(+1.23)#10,486 |
1
Common Questions
What are the Top Zip Codes with the Highest Percentage of Population Employed in Office & Administration in Marysville, WA?
Top Zip Codes with the Highest Percentage of Population Employed in Office & Administration in Marysville, WA are:
What zip code has the Highest Percentage of Population Employed in Office & Administration in Marysville, WA?
98271 has the Highest Percentage of Population Employed in Office & Administration in Marysville, WA with 12.6%.
What is the Percentage of Population Employed in Office & Administration in Marysville, WA?
Percentage of Population Employed in Office & Administration in Marysville is 12.4%.
What is the Percentage of Population Employed in Office & Administration in Washington?
Percentage of Population Employed in Office & Administration in Washington is 9.8%.
What is the Percentage of Population Employed in Office & Administration in the United States?
Percentage of Population Employed in Office & Administration in the United States is 10.9%.