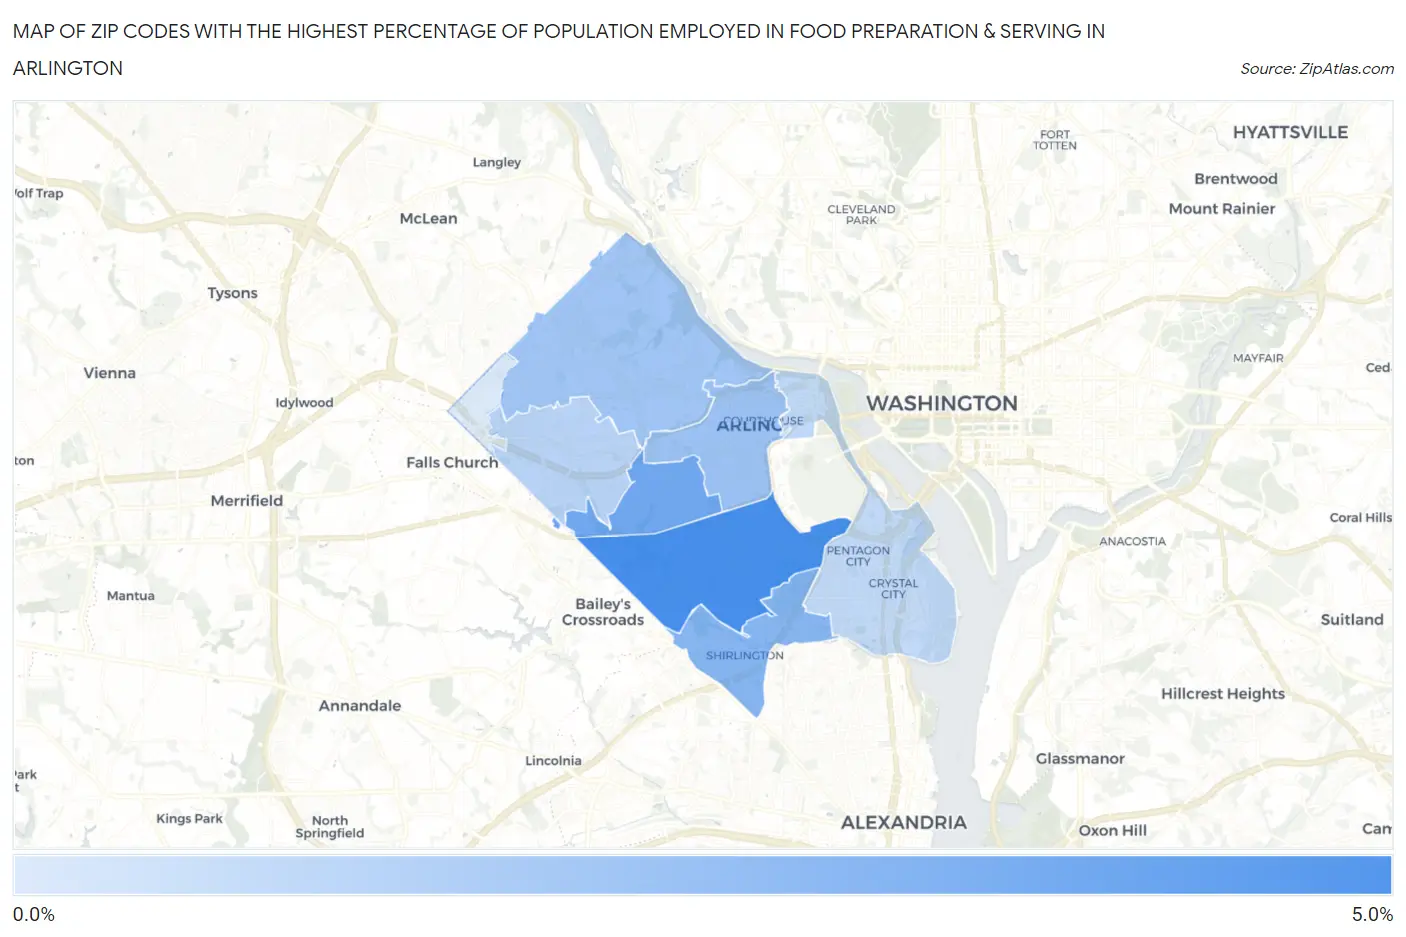
Zip Codes with the Highest Percentage of Population Employed in Food Preparation & Serving in Arlington, VA
RELATED REPORTS & OPTIONS
Food Preparation & Serving
Arlington
Compare Zip Codes
Map of Zip Codes with the Highest Percentage of Population Employed in Food Preparation & Serving in Arlington
0.34%
5.0%

Zip Codes with the Highest Percentage of Population Employed in Food Preparation & Serving in Arlington, VA
| Zip Code | % Employed | vs State | vs National | |
| 1. | 22204 | 5.0% | 4.8%(+0.173)#299 | 5.3%(-0.326)#13,108 |
| 2. | 22203 | 3.7% | 4.8%(-1.10)#437 | 5.3%(-1.60)#18,404 |
| 3. | 22206 | 2.9% | 4.8%(-1.85)#532 | 5.3%(-2.34)#21,469 |
| 4. | 22201 | 2.3% | 4.8%(-2.46)#585 | 5.3%(-2.96)#23,687 |
| 5. | 22207 | 2.2% | 4.8%(-2.60)#603 | 5.3%(-3.10)#24,140 |
| 6. | 22205 | 1.5% | 4.8%(-3.32)#647 | 5.3%(-3.82)#26,067 |
| 7. | 22209 | 1.2% | 4.8%(-3.55)#665 | 5.3%(-4.05)#26,532 |
| 8. | 22202 | 1.2% | 4.8%(-3.59)#668 | 5.3%(-4.09)#26,609 |
| 9. | 22213 | 0.34% | 4.8%(-4.45)#692 | 5.3%(-4.95)#27,827 |
1
Common Questions
What are the Top 5 Zip Codes with the Highest Percentage of Population Employed in Food Preparation & Serving in Arlington, VA?
Top 5 Zip Codes with the Highest Percentage of Population Employed in Food Preparation & Serving in Arlington, VA are:
What zip code has the Highest Percentage of Population Employed in Food Preparation & Serving in Arlington, VA?
22204 has the Highest Percentage of Population Employed in Food Preparation & Serving in Arlington, VA with 5.0%.
What is the Percentage of Population Employed in Food Preparation & Serving in Arlington, VA?
Percentage of Population Employed in Food Preparation & Serving in Arlington is 2.8%.
What is the Percentage of Population Employed in Food Preparation & Serving in Virginia?
Percentage of Population Employed in Food Preparation & Serving in Virginia is 4.8%.
What is the Percentage of Population Employed in Food Preparation & Serving in the United States?
Percentage of Population Employed in Food Preparation & Serving in the United States is 5.3%.