Zip Codes with the Highest Percentage of Population Employed in Food Preparation & Serving in Norfolk, VA
RELATED REPORTS & OPTIONS
Food Preparation & Serving
Norfolk
Compare Zip Codes
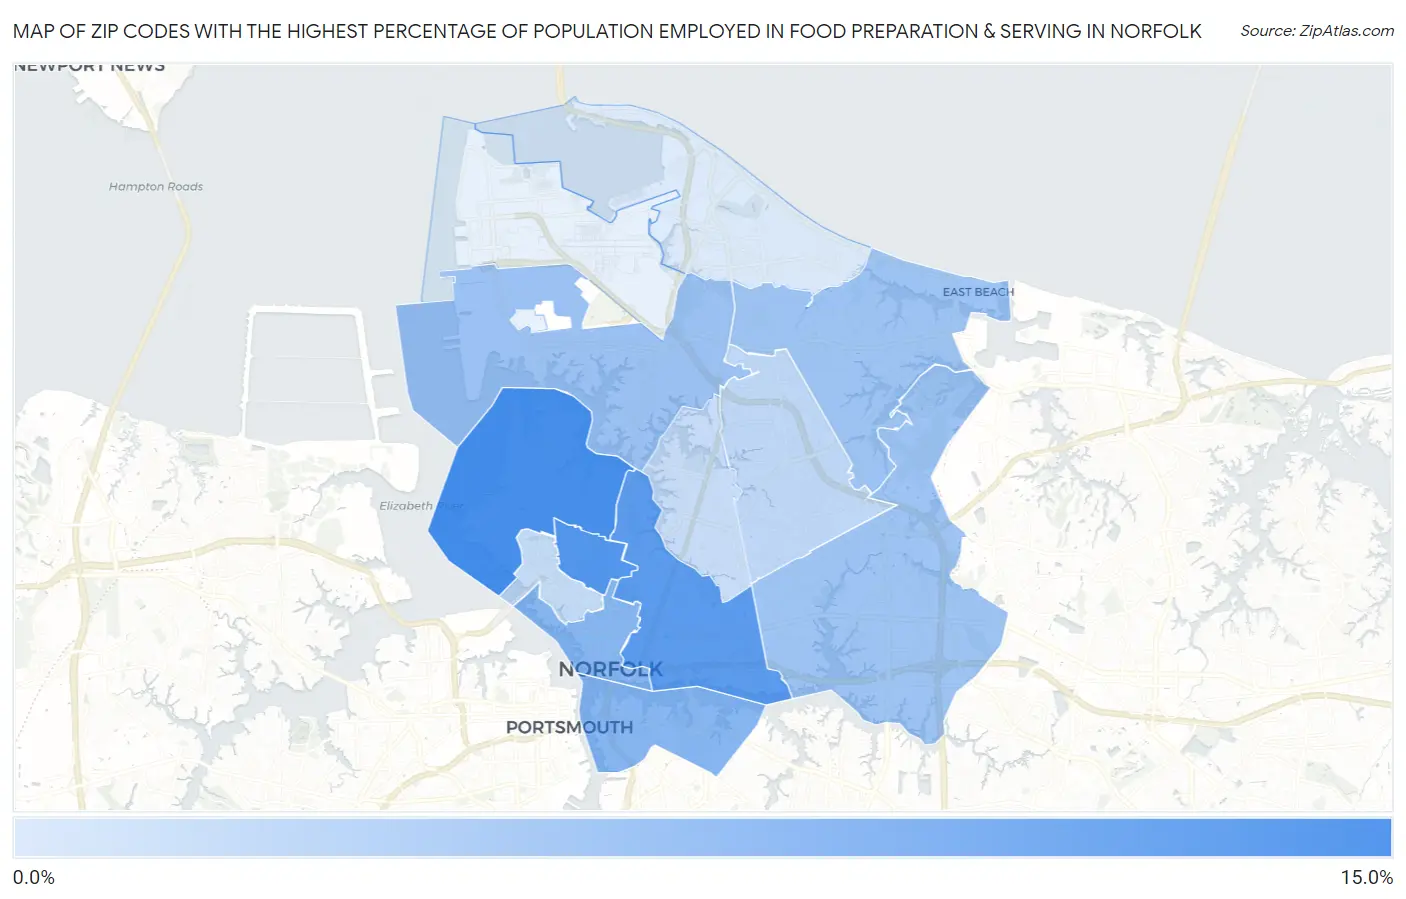
Map of Zip Codes with the Highest Percentage of Population Employed in Food Preparation & Serving in Norfolk
3.3%
11.7%
Zip Codes with the Highest Percentage of Population Employed in Food Preparation & Serving in Norfolk, VA
| Zip Code | % Employed | vs State | vs National | |
| 1. | 23508 | 11.7% | 4.8%(+6.89)#50 | 5.3%(+6.39)#1,785 |
| 2. | 23517 | 11.0% | 4.8%(+6.25)#53 | 5.3%(+5.75)#2,040 |
| 3. | 23504 | 10.4% | 4.8%(+5.66)#64 | 5.3%(+5.16)#2,353 |
| 4. | 23510 | 8.1% | 4.8%(+3.28)#120 | 5.3%(+2.78)#4,630 |
| 5. | 23523 | 8.0% | 4.8%(+3.20)#121 | 5.3%(+2.70)#4,742 |
| 6. | 23505 | 6.9% | 4.8%(+2.11)#156 | 5.3%(+1.61)#6,843 |
| 7. | 23502 | 6.7% | 4.8%(+1.96)#163 | 5.3%(+1.46)#7,215 |
| 8. | 23518 | 6.7% | 4.8%(+1.90)#172 | 5.3%(+1.40)#7,360 |
| 9. | 23513 | 5.0% | 4.8%(+0.203)#294 | 5.3%(-0.296)#13,000 |
| 10. | 23507 | 4.7% | 4.8%(-0.125)#328 | 5.3%(-0.625)#14,322 |
| 11. | 23509 | 4.5% | 4.8%(-0.265)#345 | 5.3%(-0.765)#14,929 |
| 12. | 23503 | 3.3% | 4.8%(-1.44)#484 | 5.3%(-1.94)#19,843 |
1
Common Questions
What are the Top 10 Zip Codes with the Highest Percentage of Population Employed in Food Preparation & Serving in Norfolk, VA?
Top 10 Zip Codes with the Highest Percentage of Population Employed in Food Preparation & Serving in Norfolk, VA are:
What zip code has the Highest Percentage of Population Employed in Food Preparation & Serving in Norfolk, VA?
23508 has the Highest Percentage of Population Employed in Food Preparation & Serving in Norfolk, VA with 11.7%.
What is the Percentage of Population Employed in Food Preparation & Serving in Norfolk, VA?
Percentage of Population Employed in Food Preparation & Serving in Norfolk is 6.8%.
What is the Percentage of Population Employed in Food Preparation & Serving in Virginia?
Percentage of Population Employed in Food Preparation & Serving in Virginia is 4.8%.
What is the Percentage of Population Employed in Food Preparation & Serving in the United States?
Percentage of Population Employed in Food Preparation & Serving in the United States is 5.3%.