Zip Codes with the Highest Percentage of Population Employed in Food Preparation & Serving in Chesapeake, VA
RELATED REPORTS & OPTIONS
Food Preparation & Serving
Chesapeake
Compare Zip Codes
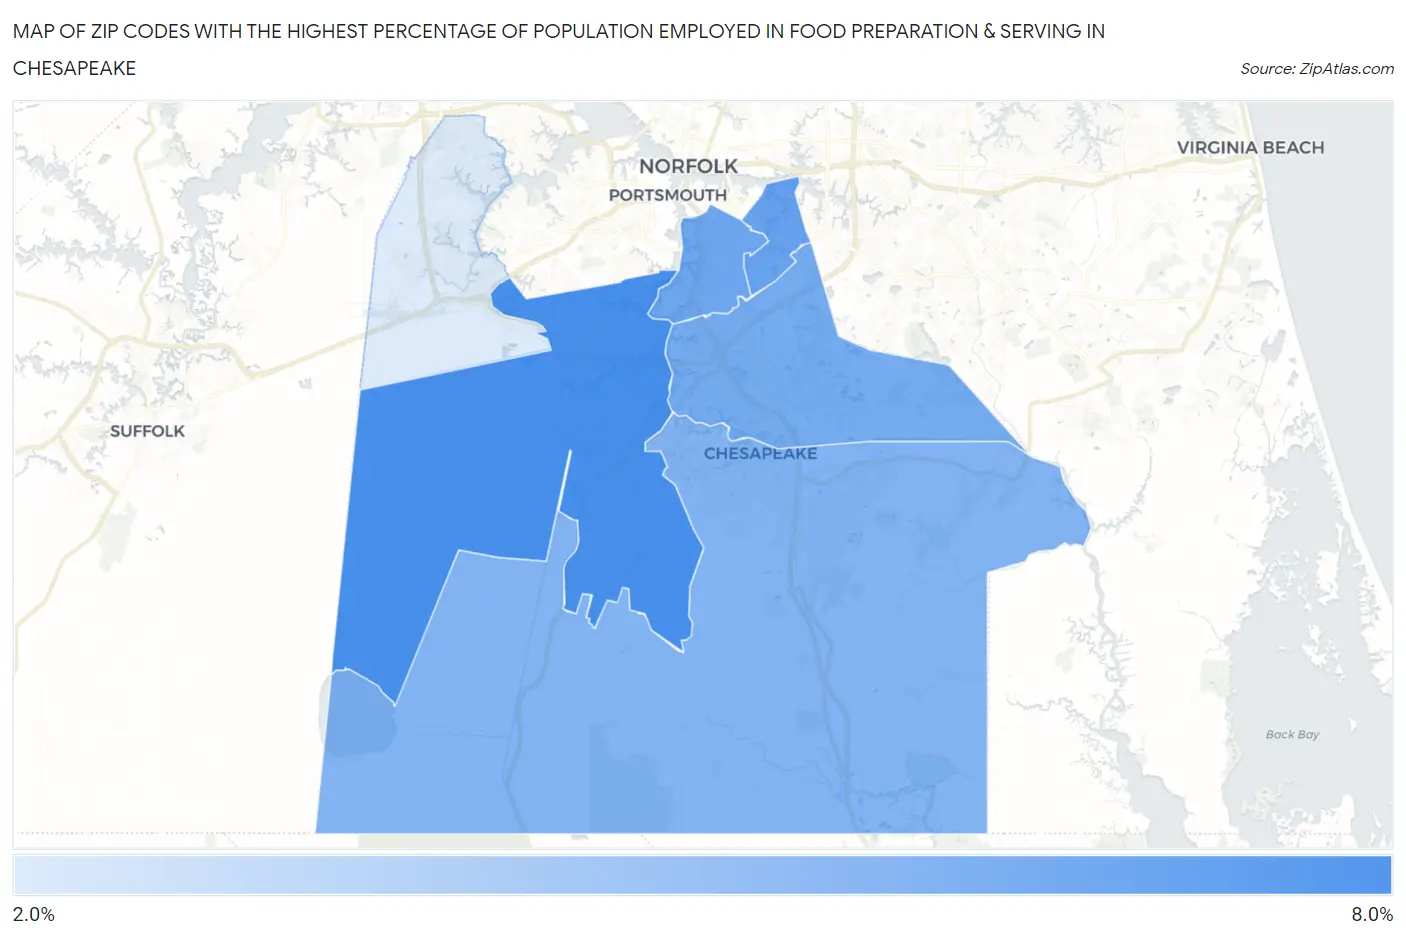
Map of Zip Codes with the Highest Percentage of Population Employed in Food Preparation & Serving in Chesapeake
2.2%
6.8%
Zip Codes with the Highest Percentage of Population Employed in Food Preparation & Serving in Chesapeake, VA
| Zip Code | % Employed | vs State | vs National | |
| 1. | 23323 | 6.8% | 4.8%(+2.02)#159 | 5.3%(+1.52)#7,046 |
| 2. | 23325 | 5.8% | 4.8%(+1.04)#221 | 5.3%(+0.536)#9,960 |
| 3. | 23324 | 5.5% | 4.8%(+0.761)#243 | 5.3%(+0.261)#10,906 |
| 4. | 23320 | 5.3% | 4.8%(+0.556)#259 | 5.3%(+0.056)#11,610 |
| 5. | 23322 | 5.0% | 4.8%(+0.257)#287 | 5.3%(-0.242)#12,768 |
| 6. | 23321 | 2.2% | 4.8%(-2.59)#602 | 5.3%(-3.09)#24,116 |
1
Common Questions
What are the Top 5 Zip Codes with the Highest Percentage of Population Employed in Food Preparation & Serving in Chesapeake, VA?
Top 5 Zip Codes with the Highest Percentage of Population Employed in Food Preparation & Serving in Chesapeake, VA are:
What zip code has the Highest Percentage of Population Employed in Food Preparation & Serving in Chesapeake, VA?
23323 has the Highest Percentage of Population Employed in Food Preparation & Serving in Chesapeake, VA with 6.8%.
What is the Percentage of Population Employed in Food Preparation & Serving in Chesapeake, VA?
Percentage of Population Employed in Food Preparation & Serving in Chesapeake is 5.1%.
What is the Percentage of Population Employed in Food Preparation & Serving in Virginia?
Percentage of Population Employed in Food Preparation & Serving in Virginia is 4.8%.
What is the Percentage of Population Employed in Food Preparation & Serving in the United States?
Percentage of Population Employed in Food Preparation & Serving in the United States is 5.3%.