Zip Codes with the Highest Percentage of Population Employed in Food Preparation & Serving in Chester, VA
RELATED REPORTS & OPTIONS
Food Preparation & Serving
Chester
Compare Zip Codes
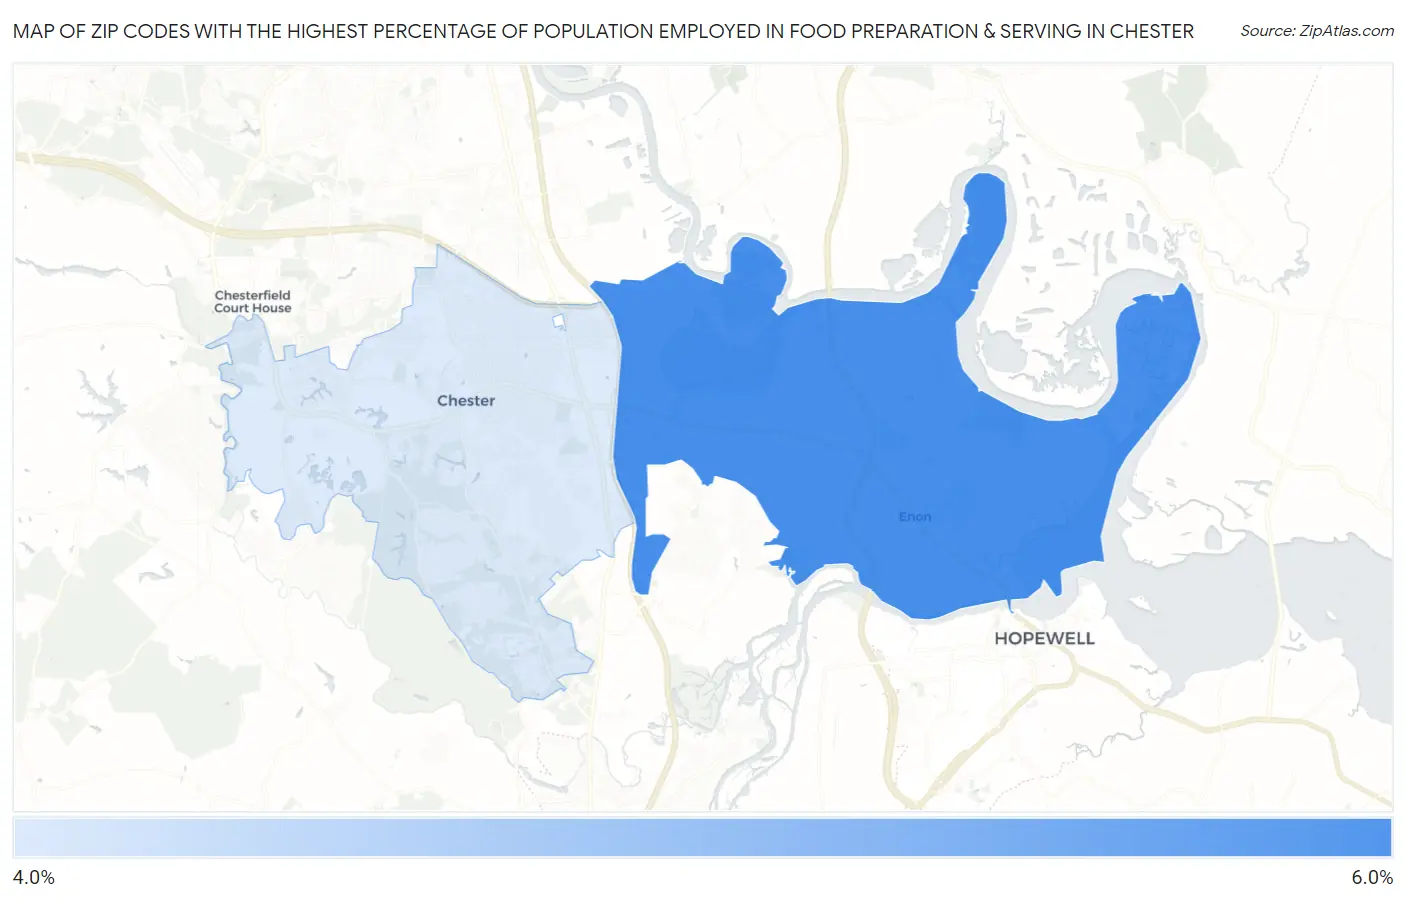
Map of Zip Codes with the Highest Percentage of Population Employed in Food Preparation & Serving in Chester
4.7%
5.6%
Zip Codes with the Highest Percentage of Population Employed in Food Preparation & Serving in Chester, VA
| Zip Code | % Employed | vs State | vs National | |
| 1. | 23836 | 5.6% | 4.8%(+0.853)#235 | 5.3%(+0.354)#10,561 |
| 2. | 23831 | 4.7% | 4.8%(-0.127)#329 | 5.3%(-0.627)#14,330 |
1
Common Questions
What are the Top Zip Codes with the Highest Percentage of Population Employed in Food Preparation & Serving in Chester, VA?
Top Zip Codes with the Highest Percentage of Population Employed in Food Preparation & Serving in Chester, VA are:
What zip code has the Highest Percentage of Population Employed in Food Preparation & Serving in Chester, VA?
23836 has the Highest Percentage of Population Employed in Food Preparation & Serving in Chester, VA with 5.6%.
What is the Percentage of Population Employed in Food Preparation & Serving in Chester, VA?
Percentage of Population Employed in Food Preparation & Serving in Chester is 5.0%.
What is the Percentage of Population Employed in Food Preparation & Serving in Virginia?
Percentage of Population Employed in Food Preparation & Serving in Virginia is 4.8%.
What is the Percentage of Population Employed in Food Preparation & Serving in the United States?
Percentage of Population Employed in Food Preparation & Serving in the United States is 5.3%.