Zip Codes with the Highest Percentage of Population Employed in Food Preparation & Serving in Mechanicsville, VA
RELATED REPORTS & OPTIONS
Food Preparation & Serving
Mechanicsville
Compare Zip Codes
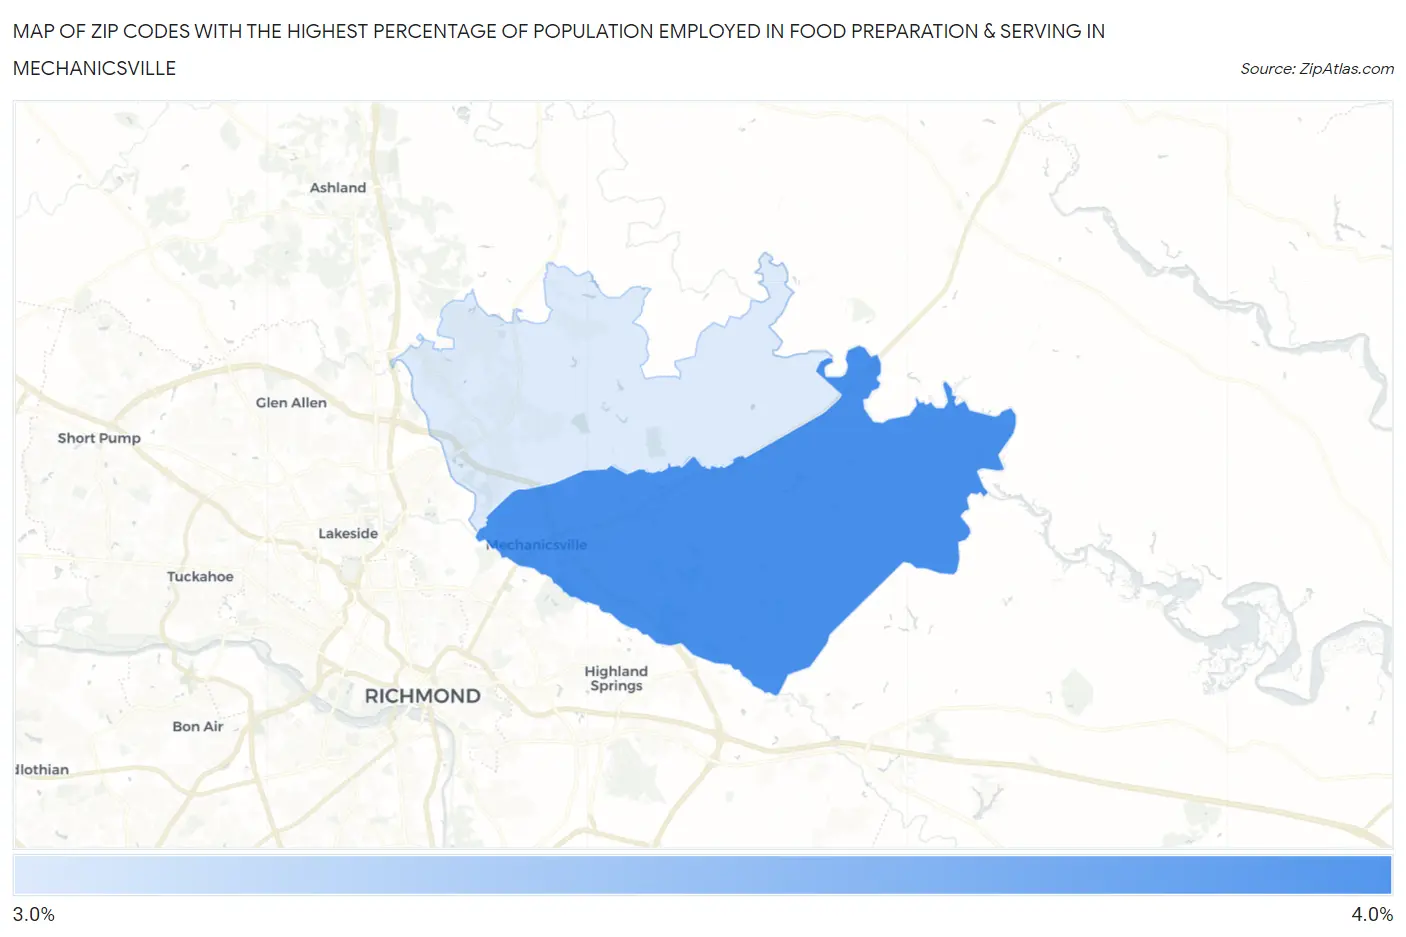
Map of Zip Codes with the Highest Percentage of Population Employed in Food Preparation & Serving in Mechanicsville
3.7%
3.9%
Zip Codes with the Highest Percentage of Population Employed in Food Preparation & Serving in Mechanicsville, VA
| Zip Code | % Employed | vs State | vs National | |
| 1. | 23111 | 3.9% | 4.8%(-0.886)#419 | 5.3%(-1.39)#17,533 |
| 2. | 23116 | 3.7% | 4.8%(-1.05)#428 | 5.3%(-1.55)#18,178 |
1
Common Questions
What are the Top Zip Codes with the Highest Percentage of Population Employed in Food Preparation & Serving in Mechanicsville, VA?
Top Zip Codes with the Highest Percentage of Population Employed in Food Preparation & Serving in Mechanicsville, VA are:
What zip code has the Highest Percentage of Population Employed in Food Preparation & Serving in Mechanicsville, VA?
23111 has the Highest Percentage of Population Employed in Food Preparation & Serving in Mechanicsville, VA with 3.9%.
What is the Percentage of Population Employed in Food Preparation & Serving in Mechanicsville, VA?
Percentage of Population Employed in Food Preparation & Serving in Mechanicsville is 5.2%.
What is the Percentage of Population Employed in Food Preparation & Serving in Virginia?
Percentage of Population Employed in Food Preparation & Serving in Virginia is 4.8%.
What is the Percentage of Population Employed in Food Preparation & Serving in the United States?
Percentage of Population Employed in Food Preparation & Serving in the United States is 5.3%.