Zip Codes with the Highest Percentage of Population Employed in Food Preparation & Serving in Lynchburg, VA
RELATED REPORTS & OPTIONS
Food Preparation & Serving
Lynchburg
Compare Zip Codes
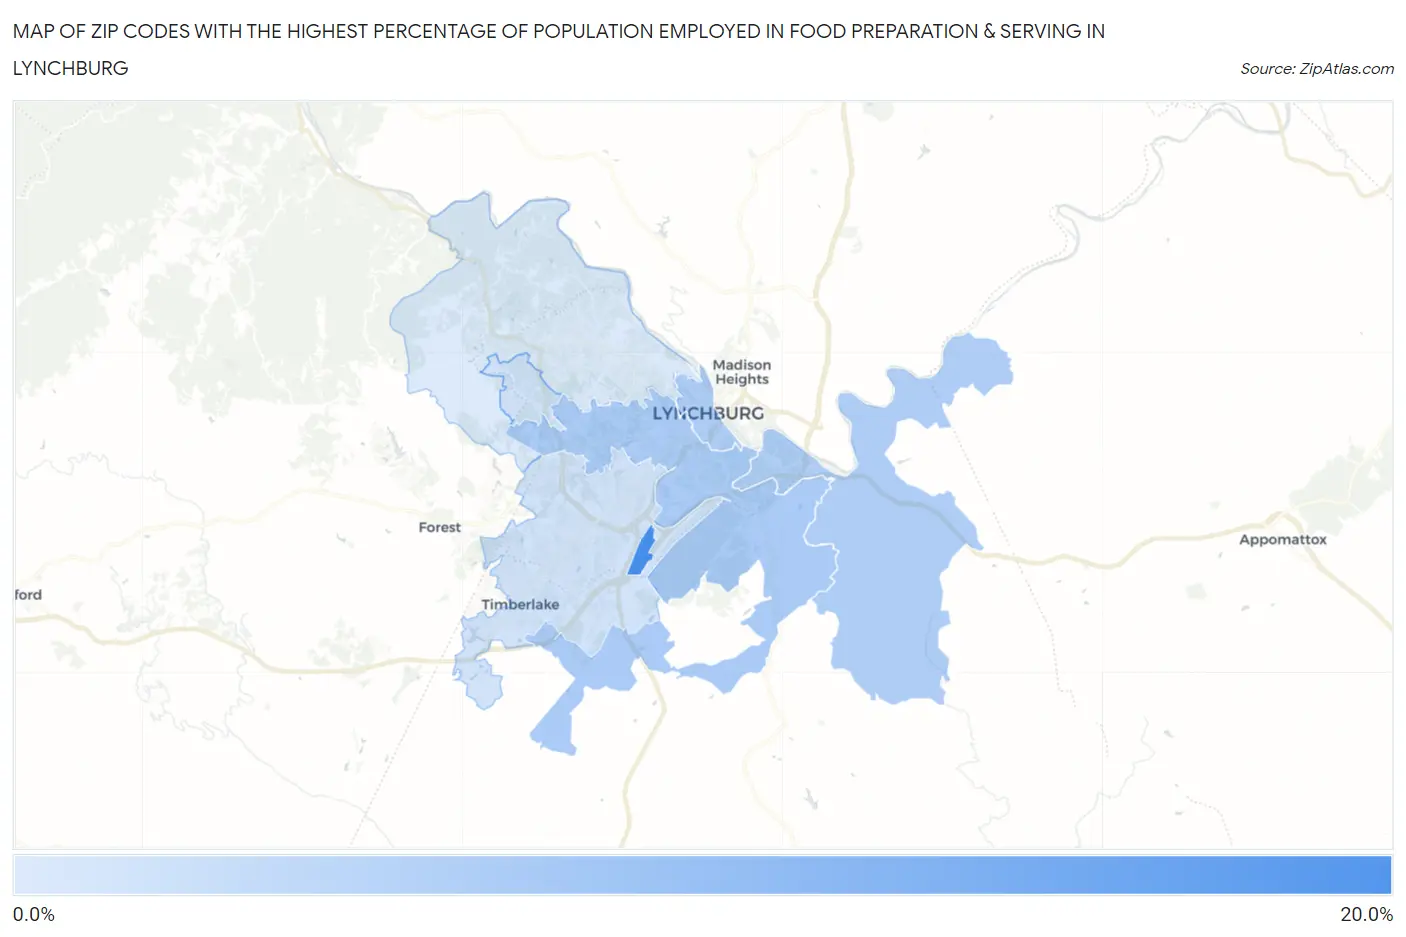
Map of Zip Codes with the Highest Percentage of Population Employed in Food Preparation & Serving in Lynchburg
4.7%
18.1%
Zip Codes with the Highest Percentage of Population Employed in Food Preparation & Serving in Lynchburg, VA
| Zip Code | % Employed | vs State | vs National | |
| 1. | 24515 | 18.1% | 4.8%(+13.3)#24 | 5.3%(+12.8)#651 |
| 2. | 24501 | 9.1% | 4.8%(+4.31)#94 | 5.3%(+3.81)#3,419 |
| 3. | 24504 | 8.6% | 4.8%(+3.82)#107 | 5.3%(+3.32)#3,965 |
| 4. | 24502 | 5.8% | 4.8%(+0.967)#230 | 5.3%(+0.468)#10,171 |
| 5. | 24503 | 4.7% | 4.8%(-0.048)#319 | 5.3%(-0.547)#13,998 |
1
Common Questions
What are the Top 3 Zip Codes with the Highest Percentage of Population Employed in Food Preparation & Serving in Lynchburg, VA?
Top 3 Zip Codes with the Highest Percentage of Population Employed in Food Preparation & Serving in Lynchburg, VA are:
What zip code has the Highest Percentage of Population Employed in Food Preparation & Serving in Lynchburg, VA?
24515 has the Highest Percentage of Population Employed in Food Preparation & Serving in Lynchburg, VA with 18.1%.
What is the Percentage of Population Employed in Food Preparation & Serving in Lynchburg, VA?
Percentage of Population Employed in Food Preparation & Serving in Lynchburg is 7.9%.
What is the Percentage of Population Employed in Food Preparation & Serving in Virginia?
Percentage of Population Employed in Food Preparation & Serving in Virginia is 4.8%.
What is the Percentage of Population Employed in Food Preparation & Serving in the United States?
Percentage of Population Employed in Food Preparation & Serving in the United States is 5.3%.