Zip Codes with the Highest Percentage of Population Employed in Food Preparation & Serving in Alexandria, VA
RELATED REPORTS & OPTIONS
Food Preparation & Serving
Alexandria
Compare Zip Codes
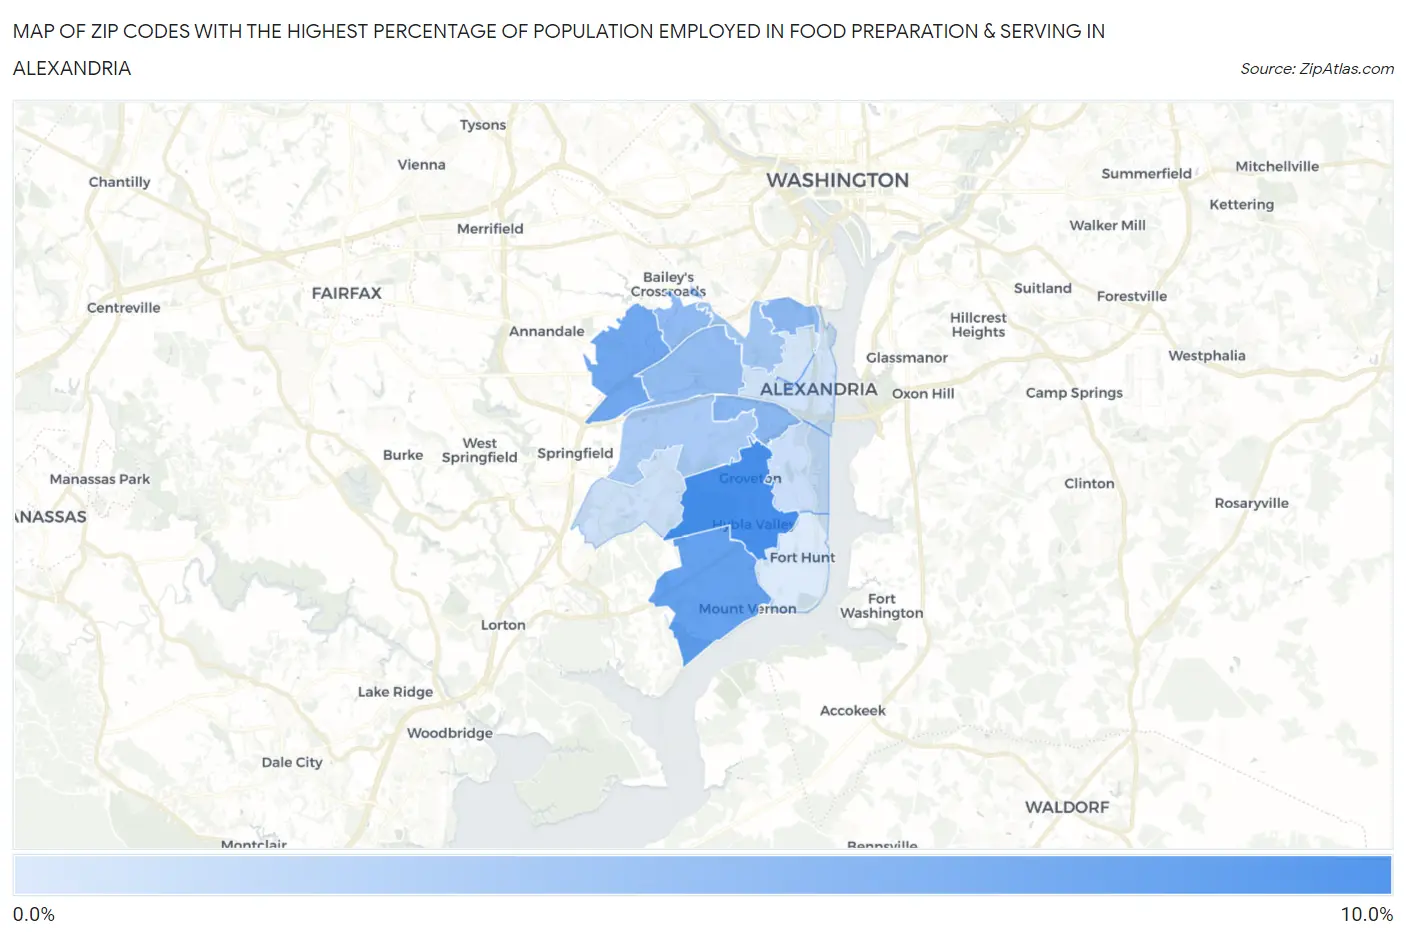
Map of Zip Codes with the Highest Percentage of Population Employed in Food Preparation & Serving in Alexandria
1.2%
8.9%
Zip Codes with the Highest Percentage of Population Employed in Food Preparation & Serving in Alexandria, VA
| Zip Code | % Employed | vs State | vs National | |
| 1. | 22306 | 8.9% | 4.8%(+4.11)#99 | 5.3%(+3.61)#3,627 |
| 2. | 22309 | 7.3% | 4.8%(+2.55)#139 | 5.3%(+2.05)#5,877 |
| 3. | 22312 | 6.7% | 4.8%(+1.94)#167 | 5.3%(+1.44)#7,271 |
| 4. | 22303 | 5.4% | 4.8%(+0.647)#249 | 5.3%(+0.147)#11,290 |
| 5. | 22305 | 5.3% | 4.8%(+0.498)#267 | 5.3%(-0.001)#11,825 |
| 6. | 22311 | 5.1% | 4.8%(+0.273)#285 | 5.3%(-0.227)#12,693 |
| 7. | 22304 | 4.9% | 4.8%(+0.146)#303 | 5.3%(-0.354)#13,218 |
| 8. | 22302 | 4.0% | 4.8%(-0.746)#398 | 5.3%(-1.25)#16,966 |
| 9. | 22310 | 3.8% | 4.8%(-1.01)#427 | 5.3%(-1.51)#18,024 |
| 10. | 22307 | 2.1% | 4.8%(-2.71)#607 | 5.3%(-3.21)#24,468 |
| 11. | 22315 | 2.0% | 4.8%(-2.80)#612 | 5.3%(-3.30)#24,744 |
| 12. | 22314 | 1.7% | 4.8%(-3.05)#632 | 5.3%(-3.55)#25,438 |
| 13. | 22301 | 1.5% | 4.8%(-3.24)#642 | 5.3%(-3.74)#25,896 |
| 14. | 22308 | 1.2% | 4.8%(-3.60)#669 | 5.3%(-4.10)#26,610 |
1
Common Questions
What are the Top 10 Zip Codes with the Highest Percentage of Population Employed in Food Preparation & Serving in Alexandria, VA?
Top 10 Zip Codes with the Highest Percentage of Population Employed in Food Preparation & Serving in Alexandria, VA are:
What zip code has the Highest Percentage of Population Employed in Food Preparation & Serving in Alexandria, VA?
22306 has the Highest Percentage of Population Employed in Food Preparation & Serving in Alexandria, VA with 8.9%.
What is the Percentage of Population Employed in Food Preparation & Serving in Alexandria, VA?
Percentage of Population Employed in Food Preparation & Serving in Alexandria is 4.1%.
What is the Percentage of Population Employed in Food Preparation & Serving in Virginia?
Percentage of Population Employed in Food Preparation & Serving in Virginia is 4.8%.
What is the Percentage of Population Employed in Food Preparation & Serving in the United States?
Percentage of Population Employed in Food Preparation & Serving in the United States is 5.3%.