Zip Codes with the Highest Percentage of Population Employed in Food Preparation & Serving in Midlothian, VA
RELATED REPORTS & OPTIONS
Food Preparation & Serving
Midlothian
Compare Zip Codes
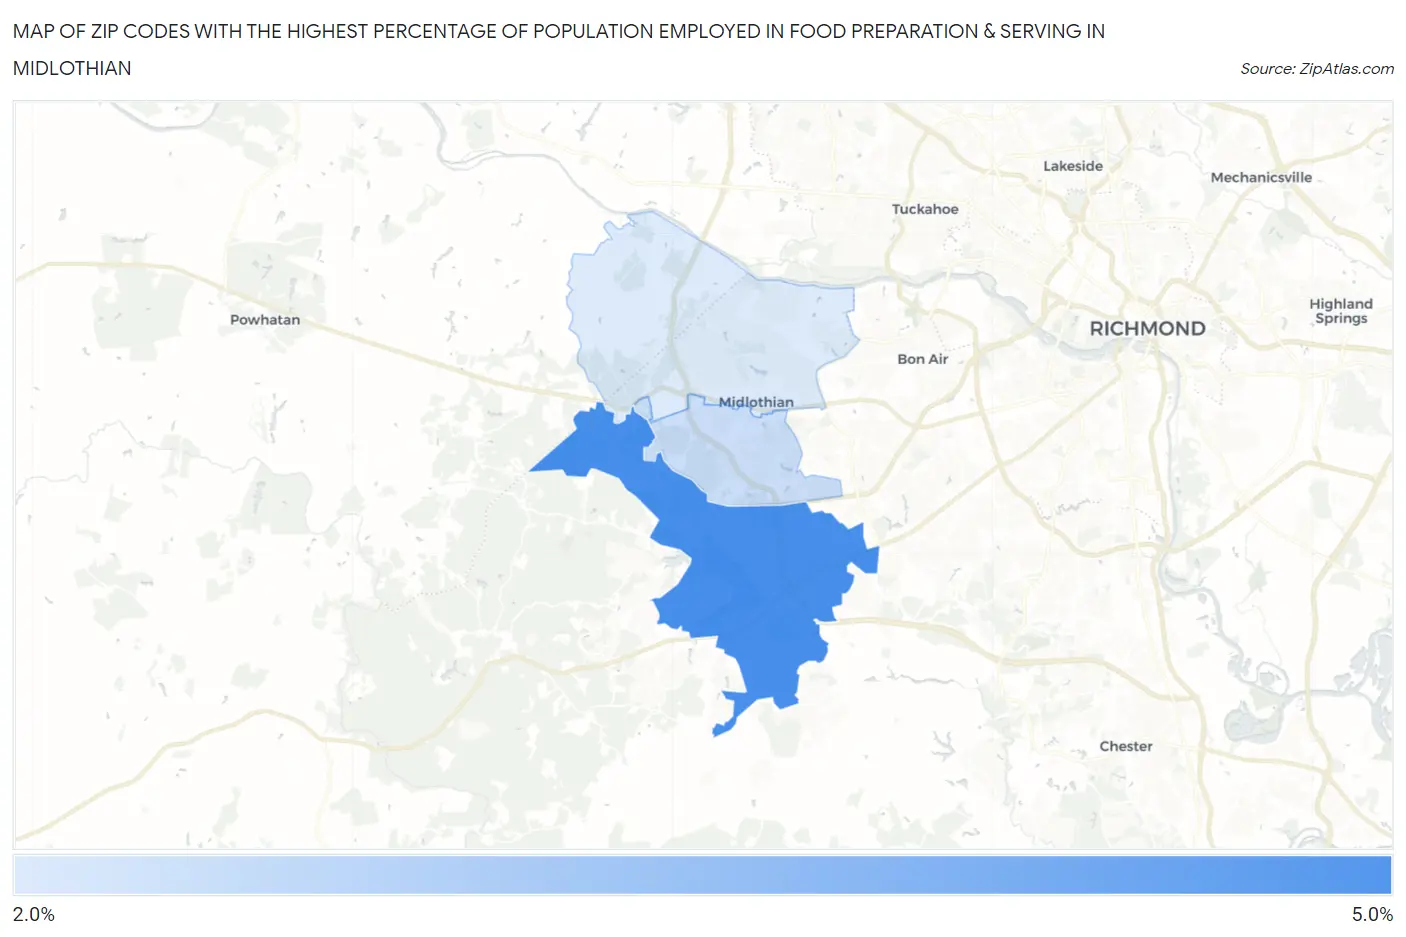
Map of Zip Codes with the Highest Percentage of Population Employed in Food Preparation & Serving in Midlothian
2.9%
4.6%
Zip Codes with the Highest Percentage of Population Employed in Food Preparation & Serving in Midlothian, VA
| Zip Code | % Employed | vs State | vs National | |
| 1. | 23112 | 4.6% | 4.8%(-0.225)#341 | 5.3%(-0.725)#14,782 |
| 2. | 23114 | 3.1% | 4.8%(-1.68)#505 | 5.3%(-2.18)#20,843 |
| 3. | 23113 | 2.9% | 4.8%(-1.87)#536 | 5.3%(-2.37)#21,594 |
1
Common Questions
What are the Top Zip Codes with the Highest Percentage of Population Employed in Food Preparation & Serving in Midlothian, VA?
Top Zip Codes with the Highest Percentage of Population Employed in Food Preparation & Serving in Midlothian, VA are:
What zip code has the Highest Percentage of Population Employed in Food Preparation & Serving in Midlothian, VA?
23112 has the Highest Percentage of Population Employed in Food Preparation & Serving in Midlothian, VA with 4.6%.
What is the Percentage of Population Employed in Food Preparation & Serving in Midlothian, VA?
Percentage of Population Employed in Food Preparation & Serving in Midlothian is 3.4%.
What is the Percentage of Population Employed in Food Preparation & Serving in Virginia?
Percentage of Population Employed in Food Preparation & Serving in Virginia is 4.8%.
What is the Percentage of Population Employed in Food Preparation & Serving in the United States?
Percentage of Population Employed in Food Preparation & Serving in the United States is 5.3%.