Zip Codes with the Highest Percentage of Population Employed in Food Preparation & Serving in Portsmouth, VA
RELATED REPORTS & OPTIONS
Food Preparation & Serving
Portsmouth
Compare Zip Codes
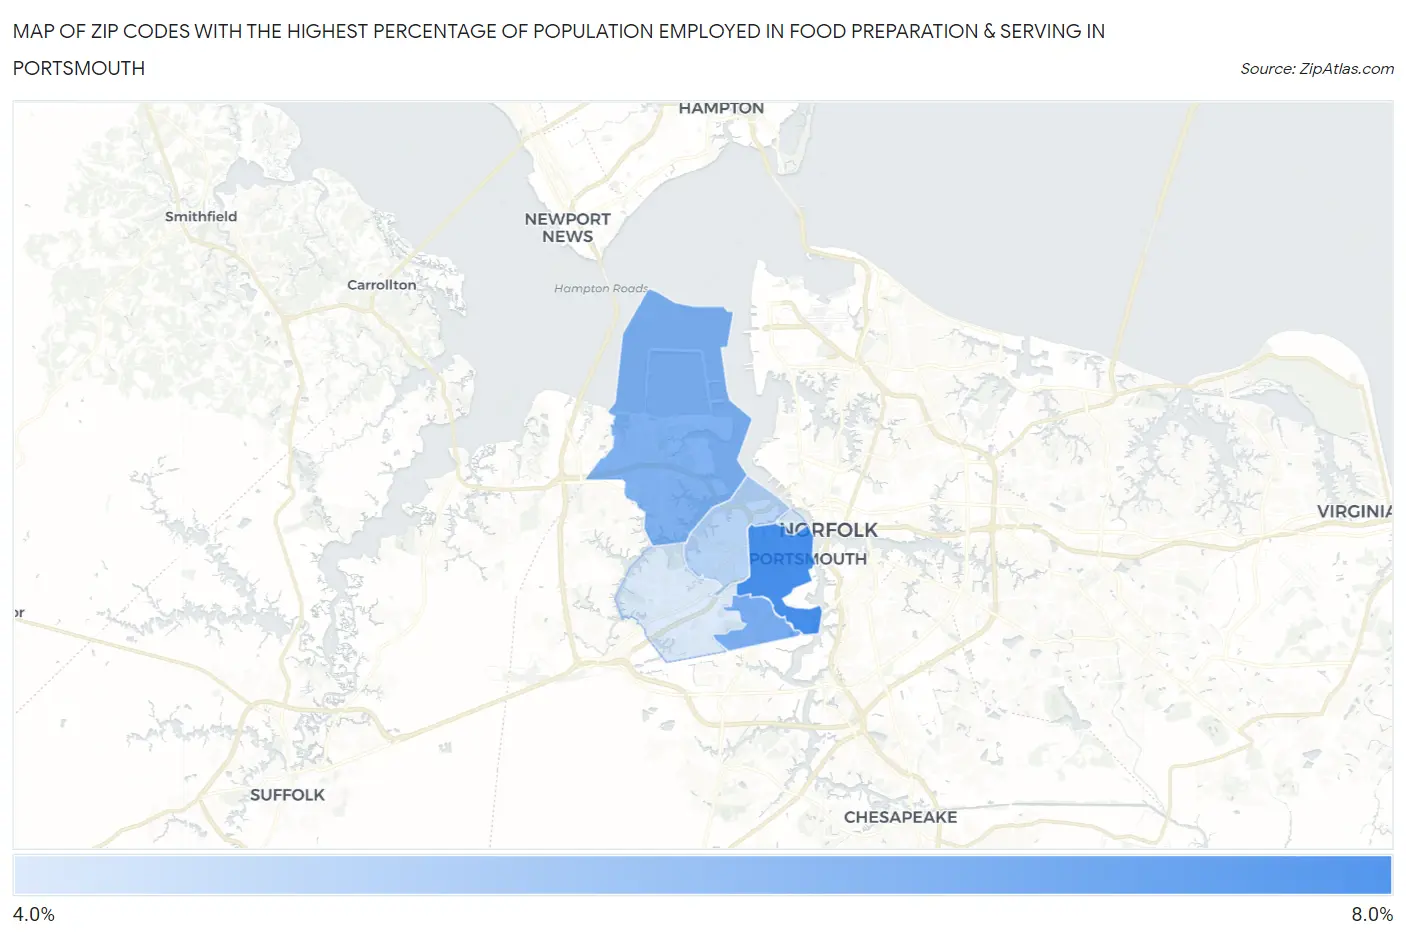
Map of Zip Codes with the Highest Percentage of Population Employed in Food Preparation & Serving in Portsmouth
4.1%
6.2%
Zip Codes with the Highest Percentage of Population Employed in Food Preparation & Serving in Portsmouth, VA
| Zip Code | % Employed | vs State | vs National | |
| 1. | 23704 | 6.2% | 4.8%(+1.37)#197 | 5.3%(+0.866)#8,873 |
| 2. | 23702 | 5.4% | 4.8%(+0.655)#246 | 5.3%(+0.156)#11,254 |
| 3. | 23703 | 5.4% | 4.8%(+0.575)#256 | 5.3%(+0.075)#11,532 |
| 4. | 23707 | 4.6% | 4.8%(-0.223)#340 | 5.3%(-0.722)#14,768 |
| 5. | 23701 | 4.1% | 4.8%(-0.692)#392 | 5.3%(-1.19)#16,727 |
1
Common Questions
What are the Top 5 Zip Codes with the Highest Percentage of Population Employed in Food Preparation & Serving in Portsmouth, VA?
Top 5 Zip Codes with the Highest Percentage of Population Employed in Food Preparation & Serving in Portsmouth, VA are:
What zip code has the Highest Percentage of Population Employed in Food Preparation & Serving in Portsmouth, VA?
23704 has the Highest Percentage of Population Employed in Food Preparation & Serving in Portsmouth, VA with 6.2%.
What is the Percentage of Population Employed in Food Preparation & Serving in Portsmouth, VA?
Percentage of Population Employed in Food Preparation & Serving in Portsmouth is 5.1%.
What is the Percentage of Population Employed in Food Preparation & Serving in Virginia?
Percentage of Population Employed in Food Preparation & Serving in Virginia is 4.8%.
What is the Percentage of Population Employed in Food Preparation & Serving in the United States?
Percentage of Population Employed in Food Preparation & Serving in the United States is 5.3%.