Zip Codes with the Highest Percentage of Population Employed in Food Preparation & Serving in Farmville, VA
RELATED REPORTS & OPTIONS
Food Preparation & Serving
Farmville
Compare Zip Codes
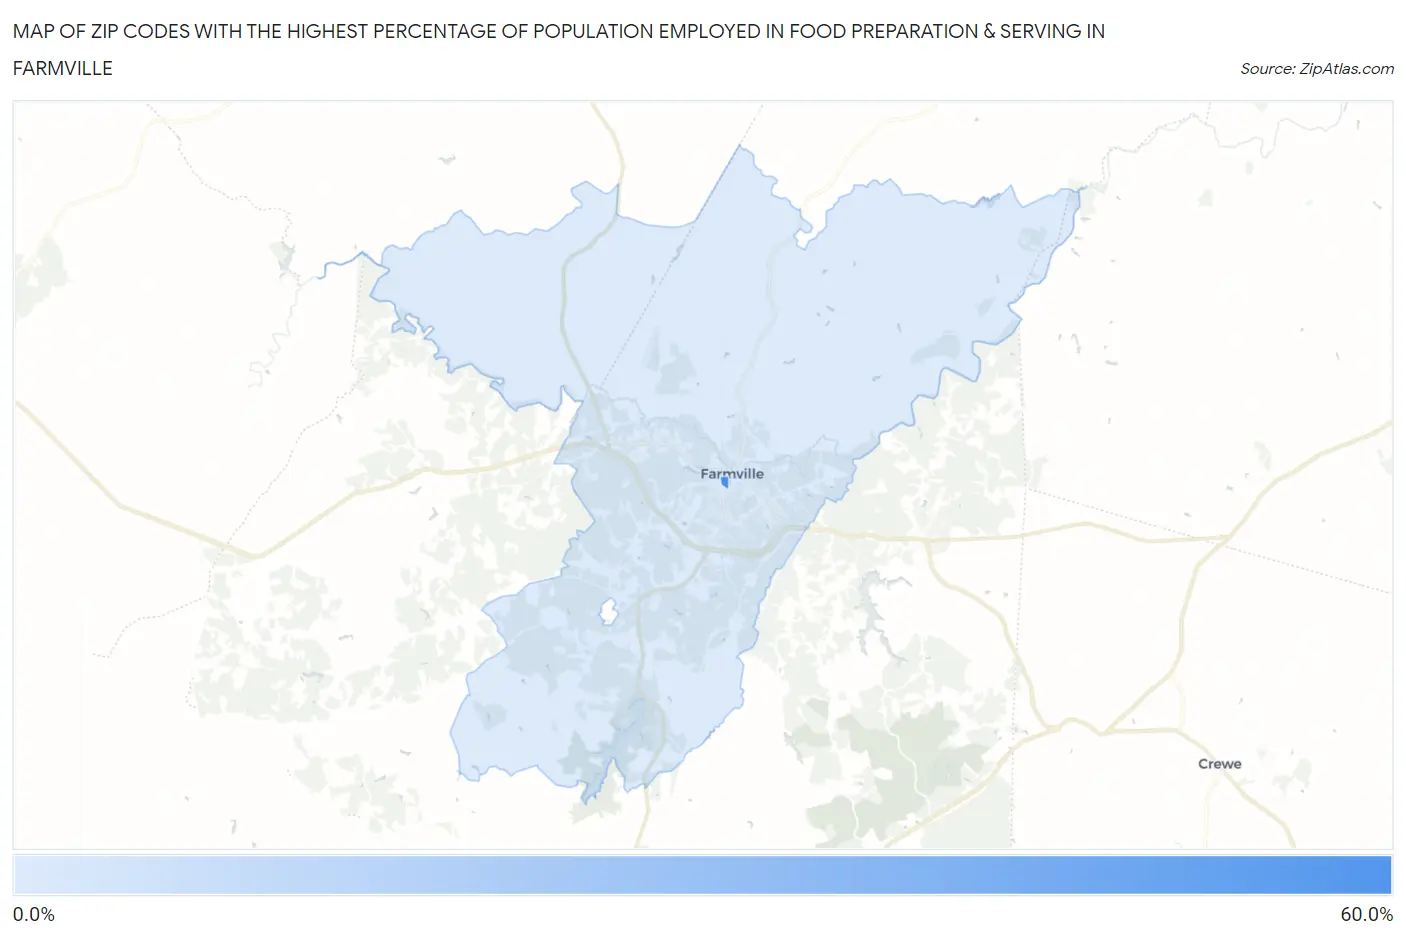
Map of Zip Codes with the Highest Percentage of Population Employed in Food Preparation & Serving in Farmville
9.2%
55.3%
Zip Codes with the Highest Percentage of Population Employed in Food Preparation & Serving in Farmville, VA
| Zip Code | % Employed | vs State | vs National | |
| 1. | 23909 | 55.3% | 4.8%(+50.5)#3 | 5.3%(+50.0)#40 |
| 2. | 23901 | 9.2% | 4.8%(+4.43)#89 | 5.3%(+3.93)#3,310 |
1
Common Questions
What are the Top Zip Codes with the Highest Percentage of Population Employed in Food Preparation & Serving in Farmville, VA?
Top Zip Codes with the Highest Percentage of Population Employed in Food Preparation & Serving in Farmville, VA are:
What zip code has the Highest Percentage of Population Employed in Food Preparation & Serving in Farmville, VA?
23909 has the Highest Percentage of Population Employed in Food Preparation & Serving in Farmville, VA with 55.3%.
What is the Percentage of Population Employed in Food Preparation & Serving in Farmville, VA?
Percentage of Population Employed in Food Preparation & Serving in Farmville is 16.9%.
What is the Percentage of Population Employed in Food Preparation & Serving in Virginia?
Percentage of Population Employed in Food Preparation & Serving in Virginia is 4.8%.
What is the Percentage of Population Employed in Food Preparation & Serving in the United States?
Percentage of Population Employed in Food Preparation & Serving in the United States is 5.3%.