Zip Codes with the Highest Percentage of Population Employed in Food Preparation & Serving in Fredericksburg, VA
RELATED REPORTS & OPTIONS
Food Preparation & Serving
Fredericksburg
Compare Zip Codes
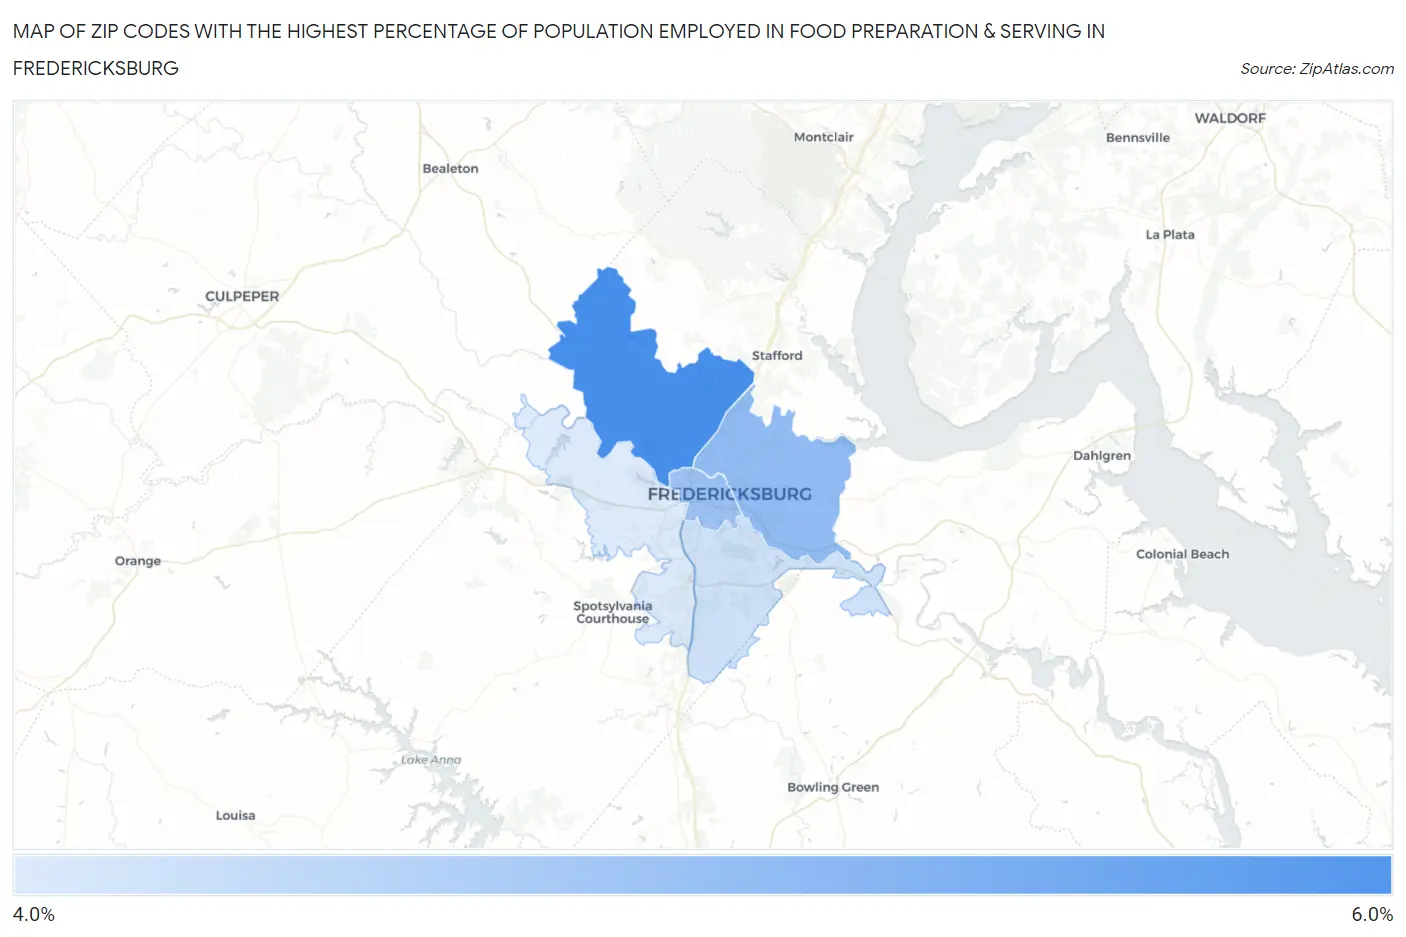
Map of Zip Codes with the Highest Percentage of Population Employed in Food Preparation & Serving in Fredericksburg
4.2%
5.9%
Zip Codes with the Highest Percentage of Population Employed in Food Preparation & Serving in Fredericksburg, VA
| Zip Code | % Employed | vs State | vs National | |
| 1. | 22406 | 5.9% | 4.8%(+1.12)#219 | 5.3%(+0.625)#9,642 |
| 2. | 22405 | 5.1% | 4.8%(+0.293)#281 | 5.3%(-0.206)#12,615 |
| 3. | 22401 | 5.0% | 4.8%(+0.178)#298 | 5.3%(-0.322)#13,087 |
| 4. | 22408 | 4.4% | 4.8%(-0.395)#357 | 5.3%(-0.894)#15,454 |
| 5. | 22407 | 4.2% | 4.8%(-0.552)#378 | 5.3%(-1.05)#16,174 |
1
Common Questions
What are the Top 3 Zip Codes with the Highest Percentage of Population Employed in Food Preparation & Serving in Fredericksburg, VA?
Top 3 Zip Codes with the Highest Percentage of Population Employed in Food Preparation & Serving in Fredericksburg, VA are:
What zip code has the Highest Percentage of Population Employed in Food Preparation & Serving in Fredericksburg, VA?
22406 has the Highest Percentage of Population Employed in Food Preparation & Serving in Fredericksburg, VA with 5.9%.
What is the Percentage of Population Employed in Food Preparation & Serving in Fredericksburg, VA?
Percentage of Population Employed in Food Preparation & Serving in Fredericksburg is 5.0%.
What is the Percentage of Population Employed in Food Preparation & Serving in Virginia?
Percentage of Population Employed in Food Preparation & Serving in Virginia is 4.8%.
What is the Percentage of Population Employed in Food Preparation & Serving in the United States?
Percentage of Population Employed in Food Preparation & Serving in the United States is 5.3%.