Zip Codes with the Highest Percentage of Population Employed in Food Preparation & Serving in Richmond, VA
RELATED REPORTS & OPTIONS
Food Preparation & Serving
Richmond
Compare Zip Codes
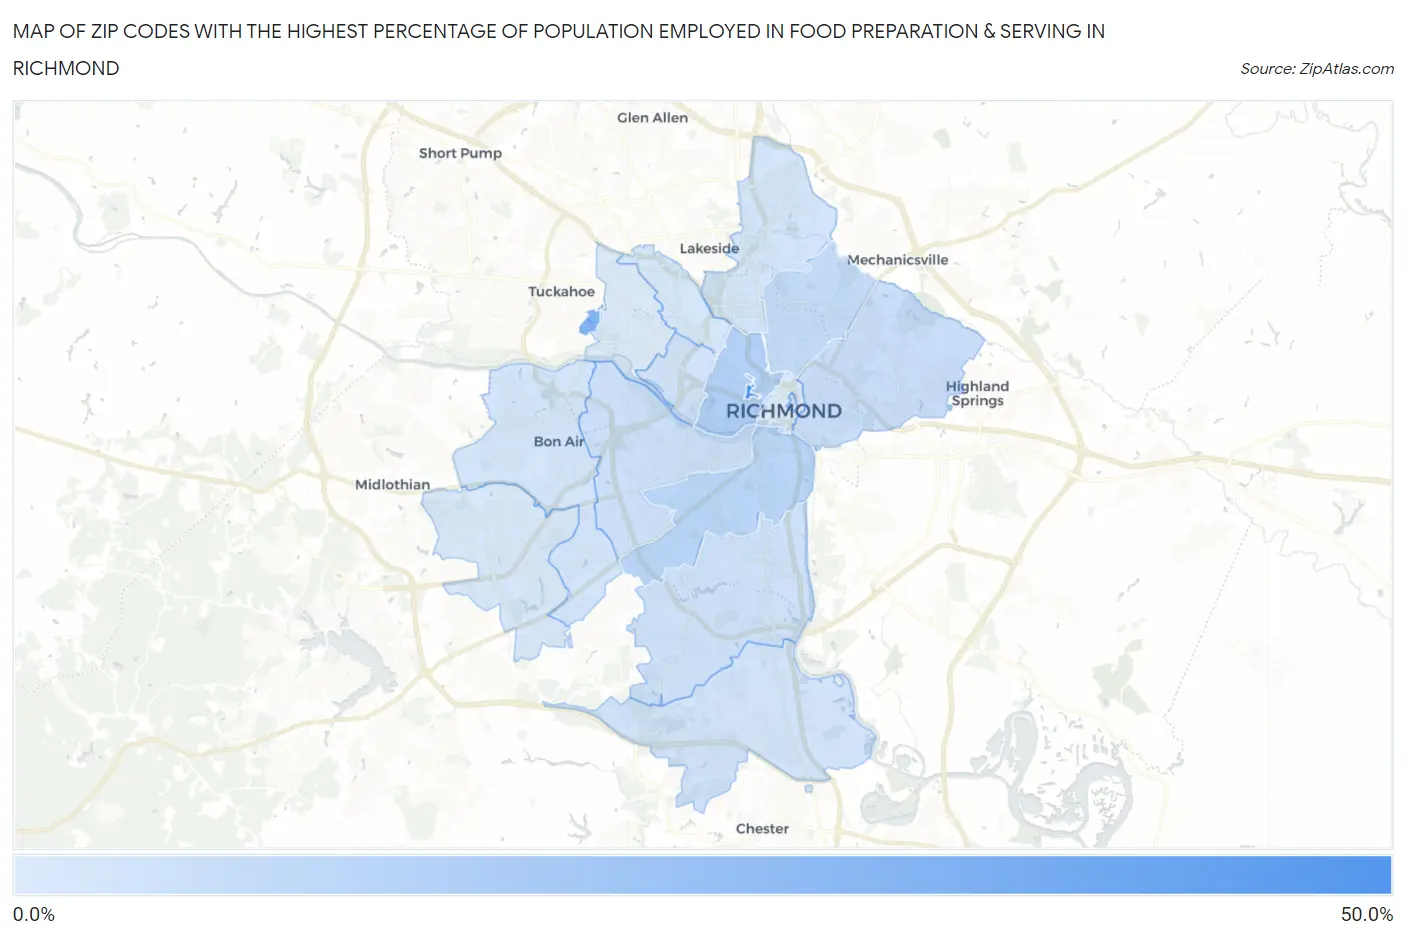
Map of Zip Codes with the Highest Percentage of Population Employed in Food Preparation & Serving in Richmond
1.5%
40.1%
Zip Codes with the Highest Percentage of Population Employed in Food Preparation & Serving in Richmond, VA
| Zip Code | % Employed | vs State | vs National | |
| 1. | 23284 | 40.1% | 4.8%(+35.3)#6 | 5.3%(+34.8)#103 |
| 2. | 23173 | 23.6% | 4.8%(+18.8)#15 | 5.3%(+18.3)#361 |
| 3. | 23220 | 11.1% | 4.8%(+6.27)#52 | 5.3%(+5.77)#2,029 |
| 4. | 23224 | 9.4% | 4.8%(+4.61)#86 | 5.3%(+4.11)#3,143 |
| 5. | 23222 | 7.2% | 4.8%(+2.44)#143 | 5.3%(+1.94)#6,077 |
| 6. | 23223 | 6.2% | 4.8%(+1.44)#192 | 5.3%(+0.945)#8,644 |
| 7. | 23298 | 5.0% | 4.8%(+0.213)#293 | 5.3%(-0.286)#12,965 |
| 8. | 23225 | 5.0% | 4.8%(+0.178)#297 | 5.3%(-0.321)#13,080 |
| 9. | 23234 | 4.5% | 4.8%(-0.263)#344 | 5.3%(-0.763)#14,925 |
| 10. | 23237 | 4.3% | 4.8%(-0.460)#366 | 5.3%(-0.960)#15,758 |
| 11. | 23221 | 4.0% | 4.8%(-0.771)#400 | 5.3%(-1.27)#17,068 |
| 12. | 23235 | 3.6% | 4.8%(-1.14)#445 | 5.3%(-1.64)#18,591 |
| 13. | 23227 | 3.6% | 4.8%(-1.16)#446 | 5.3%(-1.65)#18,643 |
| 14. | 23230 | 3.3% | 4.8%(-1.48)#491 | 5.3%(-1.98)#20,045 |
| 15. | 23236 | 2.7% | 4.8%(-2.08)#553 | 5.3%(-2.58)#22,393 |
| 16. | 23226 | 1.8% | 4.8%(-3.03)#631 | 5.3%(-3.53)#25,372 |
| 17. | 23219 | 1.5% | 4.8%(-3.25)#643 | 5.3%(-3.75)#25,902 |
1
Common Questions
What are the Top 10 Zip Codes with the Highest Percentage of Population Employed in Food Preparation & Serving in Richmond, VA?
Top 10 Zip Codes with the Highest Percentage of Population Employed in Food Preparation & Serving in Richmond, VA are:
What zip code has the Highest Percentage of Population Employed in Food Preparation & Serving in Richmond, VA?
23284 has the Highest Percentage of Population Employed in Food Preparation & Serving in Richmond, VA with 40.1%.
What is the Percentage of Population Employed in Food Preparation & Serving in Richmond, VA?
Percentage of Population Employed in Food Preparation & Serving in Richmond is 6.7%.
What is the Percentage of Population Employed in Food Preparation & Serving in Virginia?
Percentage of Population Employed in Food Preparation & Serving in Virginia is 4.8%.
What is the Percentage of Population Employed in Food Preparation & Serving in the United States?
Percentage of Population Employed in Food Preparation & Serving in the United States is 5.3%.