Zip Codes with the Highest Percentage of Population Employed in Food Preparation & Serving in Dumfries, VA
RELATED REPORTS & OPTIONS
Food Preparation & Serving
Dumfries
Compare Zip Codes
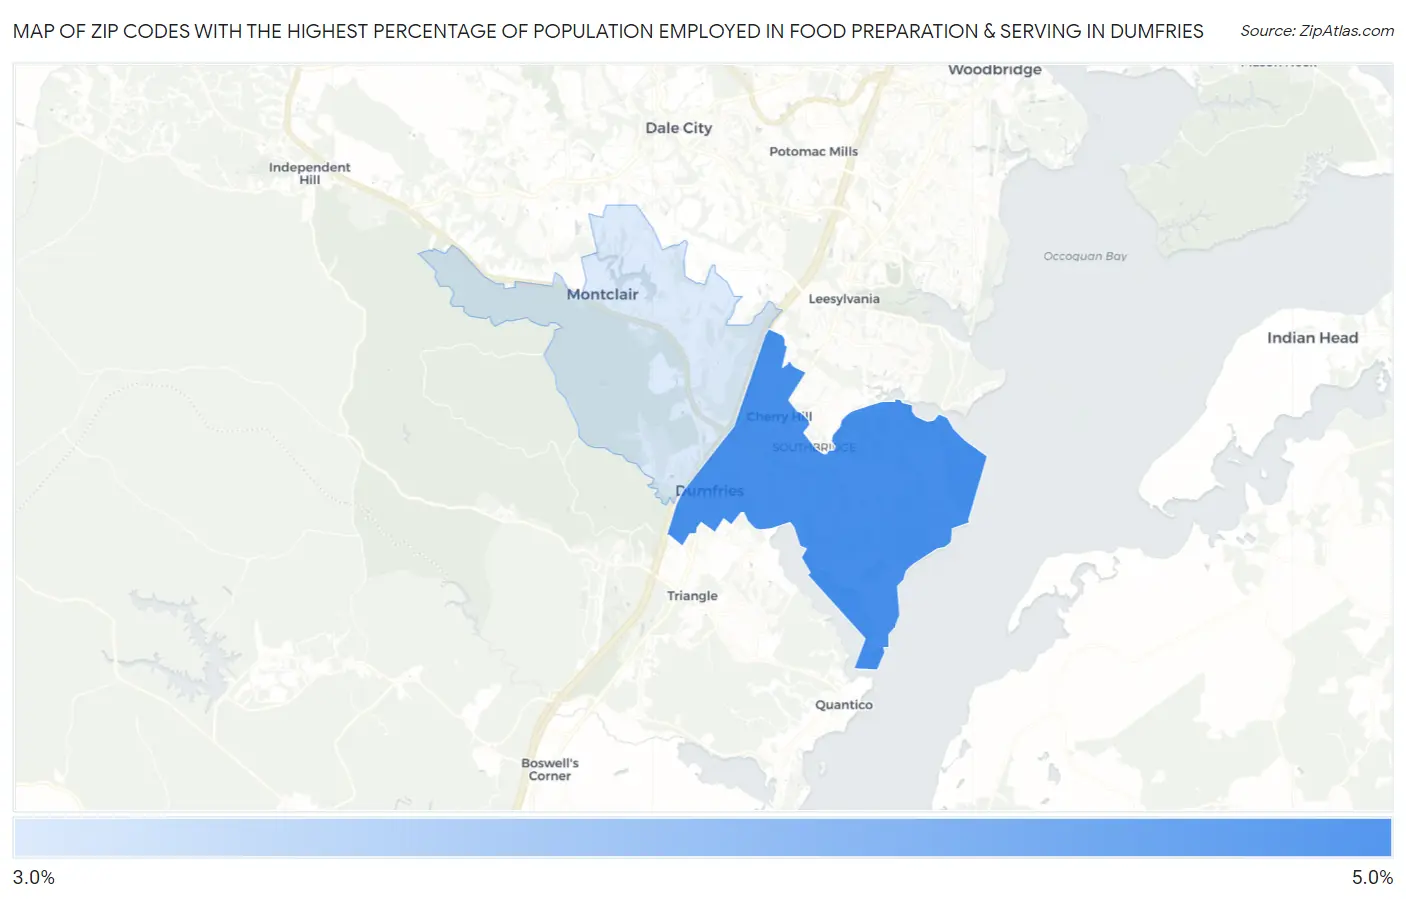
Map of Zip Codes with the Highest Percentage of Population Employed in Food Preparation & Serving in Dumfries
3.2%
4.2%
Zip Codes with the Highest Percentage of Population Employed in Food Preparation & Serving in Dumfries, VA
| Zip Code | % Employed | vs State | vs National | |
| 1. | 22026 | 4.2% | 4.8%(-0.617)#385 | 5.3%(-1.12)#16,431 |
| 2. | 22025 | 3.2% | 4.8%(-1.57)#497 | 5.3%(-2.07)#20,435 |
1
Common Questions
What are the Top Zip Codes with the Highest Percentage of Population Employed in Food Preparation & Serving in Dumfries, VA?
Top Zip Codes with the Highest Percentage of Population Employed in Food Preparation & Serving in Dumfries, VA are:
What zip code has the Highest Percentage of Population Employed in Food Preparation & Serving in Dumfries, VA?
22026 has the Highest Percentage of Population Employed in Food Preparation & Serving in Dumfries, VA with 4.2%.
What is the Percentage of Population Employed in Food Preparation & Serving in Dumfries, VA?
Percentage of Population Employed in Food Preparation & Serving in Dumfries is 11.4%.
What is the Percentage of Population Employed in Food Preparation & Serving in Virginia?
Percentage of Population Employed in Food Preparation & Serving in Virginia is 4.8%.
What is the Percentage of Population Employed in Food Preparation & Serving in the United States?
Percentage of Population Employed in Food Preparation & Serving in the United States is 5.3%.