Zip Codes with the Highest Percentage of Population Employed in Agriculture, Fishing & Hunting in Rockwall, TX
RELATED REPORTS & OPTIONS
Agriculture, Fishing & Hunting
Rockwall
Compare Zip Codes
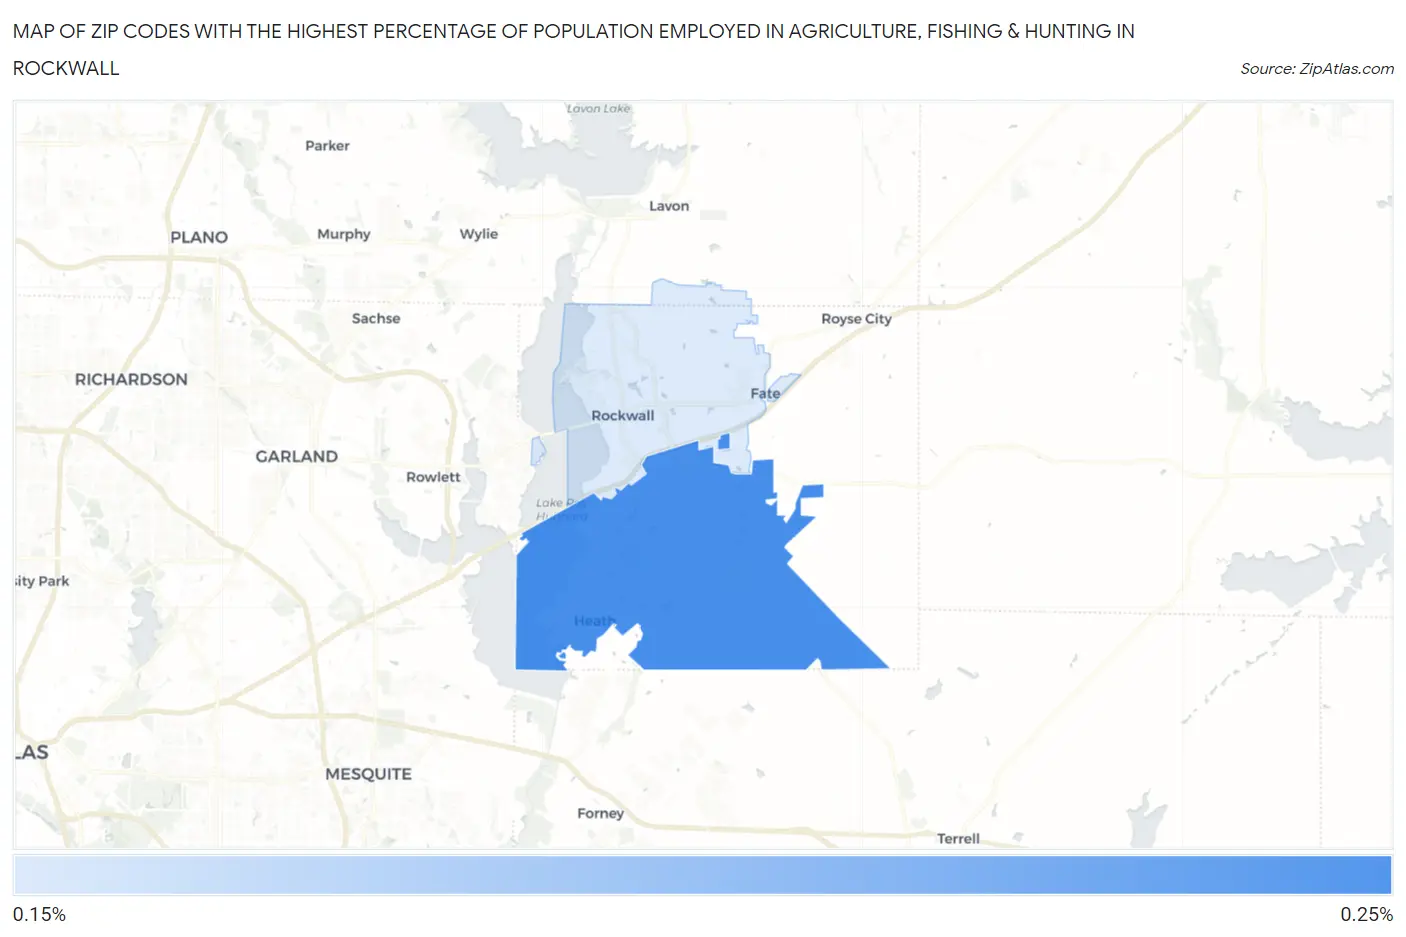
Map of Zip Codes with the Highest Percentage of Population Employed in Agriculture, Fishing & Hunting in Rockwall
0.17%
0.25%
Zip Codes with the Highest Percentage of Population Employed in Agriculture, Fishing & Hunting in Rockwall, TX
| Zip Code | % Employed | vs State | vs National | |
| 1. | 75032 | 0.25% | 0.75%(-0.505)#1,192 | 1.2%(-0.953)#21,803 |
| 2. | 75087 | 0.17% | 0.75%(-0.584)#1,276 | 1.2%(-1.03)#22,760 |
1
Common Questions
What are the Top Zip Codes with the Highest Percentage of Population Employed in Agriculture, Fishing & Hunting in Rockwall, TX?
Top Zip Codes with the Highest Percentage of Population Employed in Agriculture, Fishing & Hunting in Rockwall, TX are:
What zip code has the Highest Percentage of Population Employed in Agriculture, Fishing & Hunting in Rockwall, TX?
75032 has the Highest Percentage of Population Employed in Agriculture, Fishing & Hunting in Rockwall, TX with 0.25%.
What is the Percentage of Population Employed in Agriculture, Fishing & Hunting in Rockwall, TX?
Percentage of Population Employed in Agriculture, Fishing & Hunting in Rockwall is 0.26%.
What is the Percentage of Population Employed in Agriculture, Fishing & Hunting in Texas?
Percentage of Population Employed in Agriculture, Fishing & Hunting in Texas is 0.75%.
What is the Percentage of Population Employed in Agriculture, Fishing & Hunting in the United States?
Percentage of Population Employed in Agriculture, Fishing & Hunting in the United States is 1.2%.