Zip Codes with the Highest Percentage of Population Employed in Arts, Entertainment & Recreation in Austin, TX

RELATED REPORTS & OPTIONS

Arts, Entertainment & Recreation
Population
Families and Households
Female Fertility
Female Fertility (Unmarried)
Race (Community Size)
Race (Percentage)
Ancestry (Community Size)
AfghanAfricanAlbanianAlsatianAmericanApacheArabArgentineanArmenianAssyrian / Chaldean / SyriacAustralianAustrianBahamianBangladeshiBarbadianBasqueBelgianBelizeanBhutaneseBlackfeetBolivianBrazilianBritishBritish West IndianBulgarianBurmeseCajunCambodianCanadianCape VerdeanCelticCentral AmericanCentral American IndianCherokeeCheyenneChickasawChileanChippewaChoctawColombianComancheCosta RicanCreeCreekCroatianCrowCubanCzechCzechoslovakianDanishDelawareDominicanDutchDutch West IndianEastern EuropeanEcuadorianEgyptianEnglishEstonianEthiopianEuropeanFilipinoFinnishFrenchFrench American IndianFrench CanadianGermanGerman RussianGhanaianGreekGuamanian / ChamorroGuatemalanGuyaneseHaitianHonduranHopiHungarianIcelanderIndian (Asian)IndonesianIranianIraqiIrishIroquoisIsraeliItalianJamaicanJapaneseJordanianKenyanKiowaKoreanLaotianLatvianLebaneseLiberianLithuanianLumbeeLuxembourgerMacedonianMalaysianMalteseMexicanMexican American IndianMongolianMoroccanNative HawaiianNavajoNew ZealanderNicaraguanNigerianNorthern EuropeanNorwegianOkinawanOsagePakistaniPalestinianPanamanianParaguayanPennsylvania GermanPeruvianPolishPortuguesePotawatomiPuebloPuerto RicanRomanianRussianSalvadoranSamoanScandinavianScotch-IrishScottishSeminoleSerbianSiouxSlavicSlovakSloveneSomaliSouth AfricanSouth AmericanSouth American IndianSpaniardSpanishSpanish AmericanSpanish American IndianSri LankanSubsaharan AfricanSudaneseSwedishSwissSyrianThaiTlingit-HaidaTonganTrinidadian and TobagonianTurkishUkrainianUruguayanVenezuelanVietnameseWelshWest IndianYaquiYugoslavian
Ancestry (Percentage)
AfghanAfricanAlbanianAlsatianAmericanApacheArabArgentineanArmenianAssyrian / Chaldean / SyriacAustralianAustrianBahamianBangladeshiBarbadianBasqueBelgianBelizeanBhutaneseBlackfeetBolivianBrazilianBritishBritish West IndianBulgarianBurmeseCajunCambodianCanadianCape VerdeanCelticCentral AmericanCentral American IndianCherokeeCheyenneChickasawChileanChippewaChoctawColombianComancheCosta RicanCreeCreekCroatianCrowCubanCzechCzechoslovakianDanishDelawareDominicanDutchDutch West IndianEastern EuropeanEcuadorianEgyptianEnglishEstonianEthiopianEuropeanFilipinoFinnishFrenchFrench American IndianFrench CanadianGermanGerman RussianGhanaianGreekGuamanian / ChamorroGuatemalanGuyaneseHaitianHonduranHopiHungarianIcelanderIndian (Asian)IndonesianIranianIraqiIrishIroquoisIsraeliItalianJamaicanJapaneseJordanianKenyanKiowaKoreanLaotianLatvianLebaneseLiberianLithuanianLumbeeLuxembourgerMacedonianMalaysianMalteseMexicanMexican American IndianMongolianMoroccanNative HawaiianNavajoNew ZealanderNicaraguanNigerianNorthern EuropeanNorwegianOkinawanOsagePakistaniPalestinianPanamanianParaguayanPennsylvania GermanPeruvianPolishPortuguesePotawatomiPuebloPuerto RicanRomanianRussianSalvadoranSamoanScandinavianScotch-IrishScottishSeminoleSerbianSiouxSlavicSlovakSloveneSomaliSouth AfricanSouth AmericanSouth American IndianSpaniardSpanishSpanish AmericanSpanish American IndianSri LankanSubsaharan AfricanSudaneseSwedishSwissSyrianThaiTlingit-HaidaTonganTrinidadian and TobagonianTurkishUkrainianUruguayanVenezuelanVietnameseWelshWest IndianYaquiYugoslavian
Immigrant Origin (Total)
AfghanistanAfricaAlbaniaArgentinaAsiaAustraliaAustriaBahamasBangladeshBarbadosBelarusBelgiumBelizeBoliviaBosnia and HerzegovinaBrazilBulgariaBurma / MyanmarCambodiaCameroonCanadaCaribbeanCentral AmericaChileChinaColombiaCongoCosta RicaCroatiaCubaCzechoslovakiaDenmarkDominicaDominican RepublicEastern AfricaEastern AsiaEastern EuropeEcuadorEgyptEl SalvadorEnglandEritreaEthiopiaEuropeFranceGermanyGhanaGreeceGuatemalaGuyanaHaitiHondurasHong KongHungaryIndiaIndonesiaIranIraqIrelandIsraelItalyJamaicaJapanJordanKazakhstanKenyaKoreaKuwaitLaosLatin AmericaLatviaLebanonLiberiaLithuaniaMalaysiaMexicoMiddle AfricaMoldovaMoroccoNepalNetherlandsNicaraguaNigeriaNorthern AfricaNorthern EuropeNorwayOceaniaPakistanPanamaPeruPhilippinesPolandPortugalRomaniaRussiaSaudi ArabiaScotlandSerbiaSierra LeoneSingaporeSouth AfricaSouth AmericaSouth Central AsiaSouth Eastern AsiaSouthern EuropeSpainSri LankaSudanSwedenSwitzerlandSyriaTaiwanThailandTrinidad and TobagoTurkeyUgandaUkraineUruguayUzbekistanVenezuelaVietnamWestern AfricaWestern AsiaWestern EuropeYemenZaireZimbabwe
Immigrant Origin (Percentage)
AfghanistanAfricaAlbaniaArgentinaAsiaAustraliaAustriaBahamasBangladeshBarbadosBelarusBelgiumBelizeBoliviaBosnia and HerzegovinaBrazilBulgariaBurma / MyanmarCambodiaCameroonCanadaCaribbeanCentral AmericaChileChinaColombiaCongoCosta RicaCroatiaCubaCzechoslovakiaDenmarkDominicaDominican RepublicEastern AfricaEastern AsiaEastern EuropeEcuadorEgyptEl SalvadorEnglandEritreaEthiopiaEuropeFranceGermanyGhanaGreeceGuatemalaGuyanaHaitiHondurasHong KongHungaryIndiaIndonesiaIranIraqIrelandIsraelItalyJamaicaJapanJordanKazakhstanKenyaKoreaKuwaitLaosLatin AmericaLatviaLebanonLiberiaLithuaniaMalaysiaMexicoMiddle AfricaMoldovaMoroccoNepalNetherlandsNicaraguaNigeriaNorthern AfricaNorthern EuropeNorwayOceaniaPakistanPanamaPeruPhilippinesPolandPortugalRomaniaRussiaSaudi ArabiaScotlandSerbiaSierra LeoneSingaporeSouth AfricaSouth AmericaSouth Central AsiaSouth Eastern AsiaSouthern EuropeSpainSri LankaSudanSwedenSwitzerlandSyriaTaiwanThailandTrinidad and TobagoTurkeyUgandaUkraineUruguayUzbekistanVenezuelaVietnamWestern AfricaWestern AsiaWestern EuropeYemenZaireZimbabwe
Income
Income (Families)
Income (Households)
Poverty
Poverty (Families)
Unemployment
Employment Occupations
Employment Industries
Employer Class
Commute Time
Commute Means
School Enrollment
Education by Degree Field
Occupancy
Finances
Physical Characteristics
Austin
Compare Zip Codes
Comparison Subject

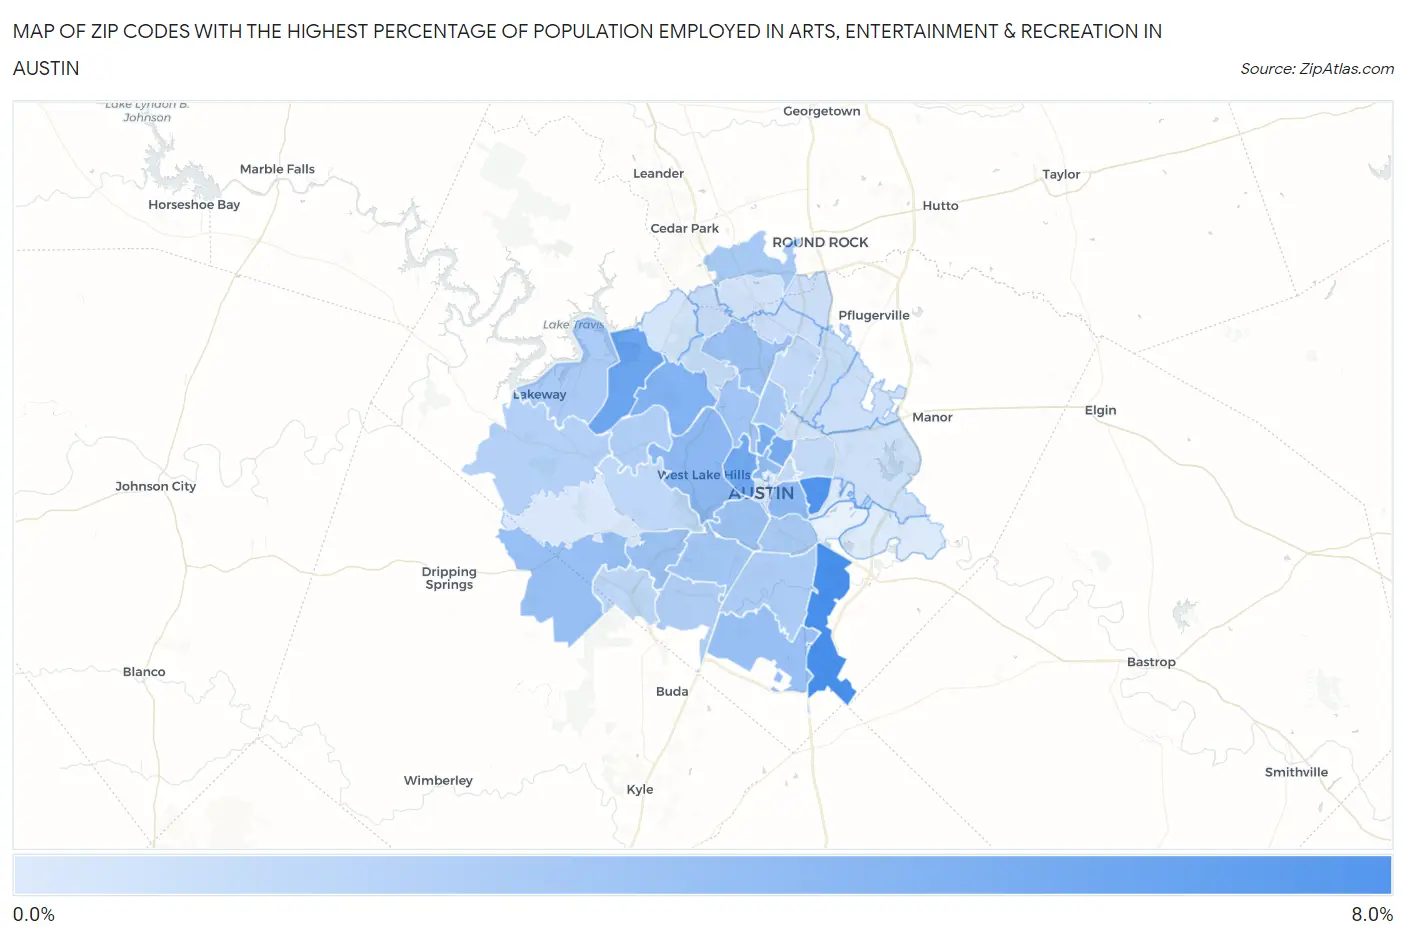
Map of Zip Codes with the Highest Percentage of Population Employed in Arts, Entertainment & Recreation in Austin

0.0%
8.0%
Zip Codes with the Highest Percentage of Population Employed in Arts, Entertainment & Recreation in Austin Map

Zip Codes with the Highest Percentage of Population Employed in Arts, Entertainment & Recreation in Austin, TX

Zip Code % Employed vs State vs National
1.787196.1%1.5%(+4.68)#312.1%(+4.06)#1,633
2.787215.8%1.5%(+4.37)#332.1%(+3.75)#1,784
3.787324.7%1.5%(+3.25)#432.1%(+2.63)#2,517
4.787034.4%1.5%(+2.94)#552.1%(+2.32)#2,842
5.787514.4%1.5%(+2.90)#592.1%(+2.28)#2,889
6.787564.2%1.5%(+2.78)#642.1%(+2.16)#3,027
7.787303.9%1.5%(+2.47)#722.1%(+1.85)#3,430
8.787023.5%1.5%(+1.99)#1012.1%(+1.37)#4,232
9.787463.4%1.5%(+1.95)#1022.1%(+1.33)#4,322
10.787053.2%1.5%(+1.71)#1192.1%(+1.09)#4,873
11.787473.0%1.5%(+1.52)#1432.1%(+0.904)#5,389
12.787373.0%1.5%(+1.52)#1442.1%(+0.904)#5,393
13.787592.9%1.5%(+1.45)#1532.1%(+0.828)#5,619
14.787042.9%1.5%(+1.44)#1552.1%(+0.824)#5,628
15.787492.9%1.5%(+1.42)#1592.1%(+0.800)#5,702
16.787312.6%1.5%(+1.16)#2002.1%(+0.544)#6,654
17.787452.5%1.5%(+1.06)#2222.1%(+0.439)#7,079
18.787572.4%1.5%(+0.952)#2412.1%(+0.332)#7,579
19.787412.4%1.5%(+0.914)#2512.1%(+0.294)#7,761
20.787172.4%1.5%(+0.902)#2522.1%(+0.282)#7,813
21.787342.3%1.5%(+0.797)#2762.1%(+0.177)#8,332
22.787442.2%1.5%(+0.708)#3002.1%(+0.088)#8,800
23.787482.1%1.5%(+0.674)#3182.1%(+0.054)#9,012
24.787332.1%1.5%(+0.631)#3292.1%(+0.011)#9,250
25.787381.9%1.5%(+0.472)#3692.1%(-0.148)#10,161
26.787351.5%1.5%(+0.069)#5422.1%(-0.551)#13,022
27.787391.5%1.5%(+0.012)#5642.1%(-0.608)#13,416
28.787221.4%1.5%(-0.021)#5892.1%(-0.641)#13,669
29.787581.4%1.5%(-0.075)#6212.1%(-0.695)#14,096
30.787231.3%1.5%(-0.119)#6392.1%(-0.739)#14,422
31.787531.3%1.5%(-0.174)#6712.1%(-0.794)#14,801
32.787501.2%1.5%(-0.277)#7292.1%(-0.897)#15,588
33.787271.1%1.5%(-0.398)#7892.1%(-1.02)#16,504
34.787541.0%1.5%(-0.434)#8092.1%(-1.05)#16,745
35.787281.0%1.5%(-0.454)#8232.1%(-1.07)#16,887
36.787240.89%1.5%(-0.575)#8802.1%(-1.20)#17,774
37.787290.80%1.5%(-0.665)#9122.1%(-1.29)#18,422
38.787520.79%1.5%(-0.673)#9162.1%(-1.29)#18,477
39.787260.74%1.5%(-0.718)#9412.1%(-1.34)#18,813
40.787010.56%1.5%(-0.899)#1,0482.1%(-1.52)#20,085
41.787360.48%1.5%(-0.978)#1,0862.1%(-1.60)#20,593
42.787250.38%1.5%(-1.08)#1,1352.1%(-1.70)#21,229

Common Questions

What are the Top 10 Zip Codes with the Highest Percentage of Population Employed in Arts, Entertainment & Recreation in Austin, TX?
Top 10 Zip Codes with the Highest Percentage of Population Employed in Arts, Entertainment & Recreation in Austin, TX are:
#1
6.1%
#2
5.8%
#3
4.7%
#4
4.4%
#5
4.4%
#6
4.2%
#7
3.9%
#8
3.5%
#9
3.4%
#10
3.2%
What zip code has the Highest Percentage of Population Employed in Arts, Entertainment & Recreation in Austin, TX?
78719 has the Highest Percentage of Population Employed in Arts, Entertainment & Recreation in Austin, TX with 6.1%.
What is the Percentage of Population Employed in Arts, Entertainment & Recreation in Austin, TX?
Percentage of Population Employed in Arts, Entertainment & Recreation in Austin is 2.2%.
What is the Percentage of Population Employed in Arts, Entertainment & Recreation in Texas?
Percentage of Population Employed in Arts, Entertainment & Recreation in Texas is 1.5%.
What is the Percentage of Population Employed in Arts, Entertainment & Recreation in the United States?
Percentage of Population Employed in Arts, Entertainment & Recreation in the United States is 2.1%.