Zip Codes with the Highest Percentage of Population Employed in Sales & Related in Austin, TX
RELATED REPORTS & OPTIONS
Sales & Related
Austin
Compare Zip Codes
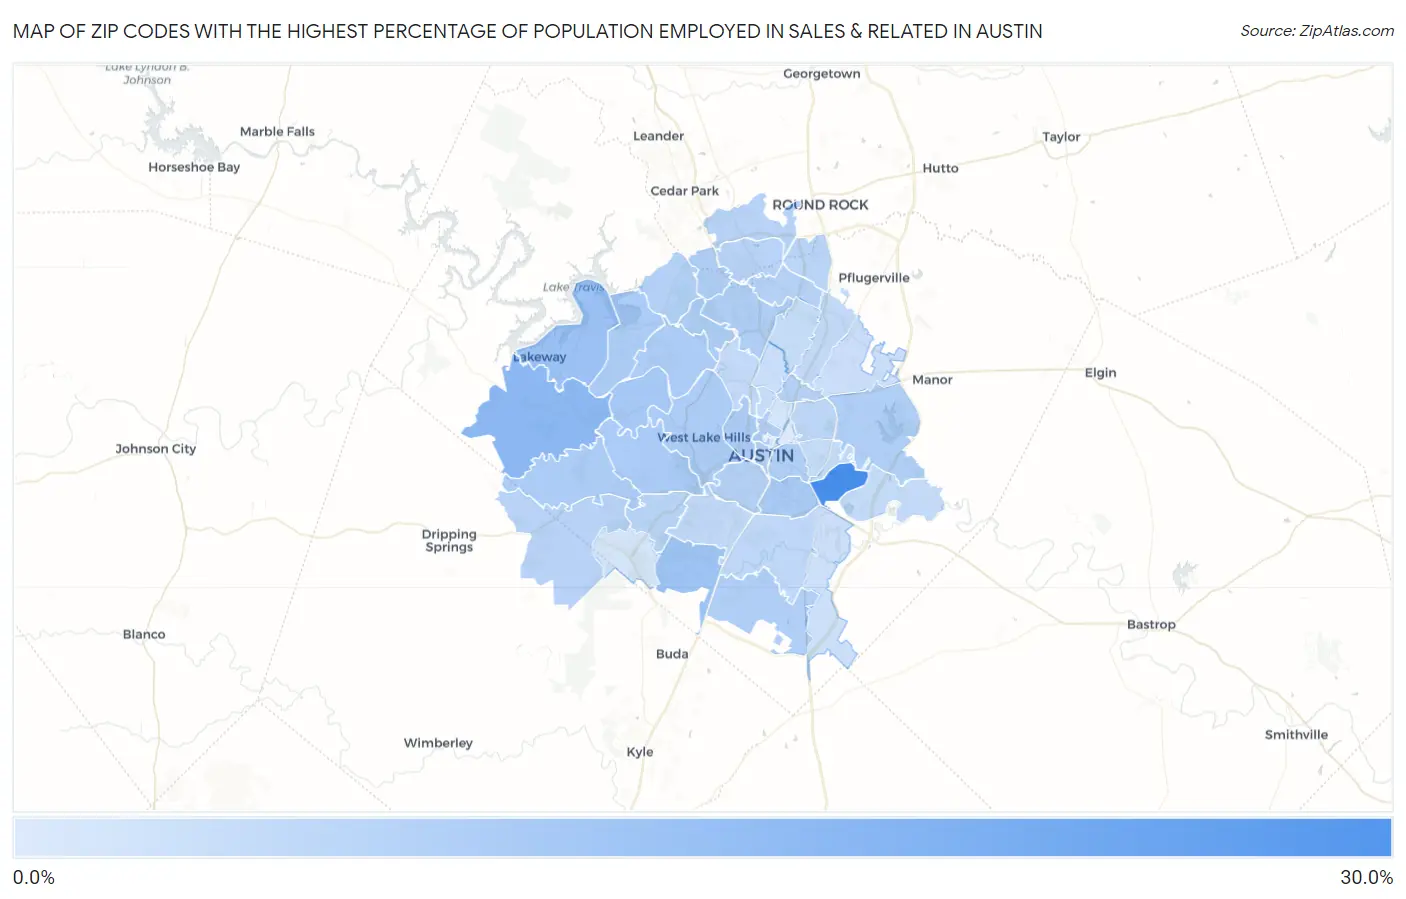
Map of Zip Codes with the Highest Percentage of Population Employed in Sales & Related in Austin
4.5%
27.1%
Zip Codes with the Highest Percentage of Population Employed in Sales & Related in Austin, TX
| Zip Code | % Employed | vs State | vs National | |
| 1. | 78742 | 27.1% | 10.2%(+16.9)#40 | 9.6%(+17.5)#515 |
| 2. | 78738 | 16.2% | 10.2%(+6.00)#121 | 9.6%(+6.63)#2,133 |
| 3. | 78734 | 14.0% | 10.2%(+3.78)#214 | 9.6%(+4.41)#3,476 |
| 4. | 78748 | 13.3% | 10.2%(+3.10)#268 | 9.6%(+3.73)#4,139 |
| 5. | 78733 | 12.5% | 10.2%(+2.24)#366 | 9.6%(+2.87)#5,220 |
| 6. | 78741 | 11.8% | 10.2%(+1.60)#456 | 9.6%(+2.22)#6,380 |
| 7. | 78735 | 11.8% | 10.2%(+1.58)#459 | 9.6%(+2.21)#6,410 |
| 8. | 78732 | 11.4% | 10.2%(+1.19)#514 | 9.6%(+1.82)#7,212 |
| 9. | 78703 | 11.4% | 10.2%(+1.17)#520 | 9.6%(+1.80)#7,272 |
| 10. | 78746 | 11.4% | 10.2%(+1.13)#527 | 9.6%(+1.76)#7,342 |
| 11. | 78730 | 11.3% | 10.2%(+1.07)#535 | 9.6%(+1.70)#7,490 |
| 12. | 78736 | 11.2% | 10.2%(+0.974)#555 | 9.6%(+1.60)#7,705 |
| 13. | 78759 | 11.0% | 10.2%(+0.758)#603 | 9.6%(+1.39)#8,252 |
| 14. | 78750 | 11.0% | 10.2%(+0.756)#604 | 9.6%(+1.39)#8,260 |
| 15. | 78724 | 10.7% | 10.2%(+0.497)#656 | 9.6%(+1.13)#8,932 |
| 16. | 78702 | 10.7% | 10.2%(+0.434)#670 | 9.6%(+1.06)#9,108 |
| 17. | 78705 | 10.7% | 10.2%(+0.429)#671 | 9.6%(+1.06)#9,116 |
| 18. | 78747 | 10.6% | 10.2%(+0.347)#685 | 9.6%(+0.976)#9,360 |
| 19. | 78726 | 10.3% | 10.2%(+0.045)#734 | 9.6%(+0.674)#10,203 |
| 20. | 78701 | 10.2% | 10.2%(-0.006)#742 | 9.6%(+0.623)#10,363 |
| 21. | 78704 | 10.2% | 10.2%(-0.049)#751 | 9.6%(+0.580)#10,506 |
| 22. | 78752 | 10.0% | 10.2%(-0.181)#782 | 9.6%(+0.448)#10,875 |
| 23. | 78727 | 9.9% | 10.2%(-0.300)#808 | 9.6%(+0.329)#11,247 |
| 24. | 78737 | 9.7% | 10.2%(-0.517)#862 | 9.6%(+0.112)#12,009 |
| 25. | 78729 | 9.6% | 10.2%(-0.593)#888 | 9.6%(+0.036)#12,278 |
| 26. | 78717 | 9.6% | 10.2%(-0.627)#901 | 9.6%(+0.002)#12,404 |
| 27. | 78749 | 9.4% | 10.2%(-0.776)#927 | 9.6%(-0.147)#12,914 |
| 28. | 78728 | 9.2% | 10.2%(-0.998)#968 | 9.6%(-0.369)#13,690 |
| 29. | 78723 | 9.1% | 10.2%(-1.11)#993 | 9.6%(-0.483)#14,106 |
| 30. | 78744 | 8.8% | 10.2%(-1.41)#1,042 | 9.6%(-0.777)#15,197 |
| 31. | 78745 | 8.5% | 10.2%(-1.76)#1,112 | 9.6%(-1.14)#16,493 |
| 32. | 78731 | 8.4% | 10.2%(-1.79)#1,114 | 9.6%(-1.16)#16,567 |
| 33. | 78753 | 8.3% | 10.2%(-1.97)#1,158 | 9.6%(-1.34)#17,225 |
| 34. | 78725 | 8.1% | 10.2%(-2.16)#1,192 | 9.6%(-1.53)#17,841 |
| 35. | 78756 | 8.0% | 10.2%(-2.18)#1,195 | 9.6%(-1.55)#17,899 |
| 36. | 78721 | 7.6% | 10.2%(-2.58)#1,248 | 9.6%(-1.95)#19,179 |
| 37. | 78758 | 7.6% | 10.2%(-2.60)#1,250 | 9.6%(-1.97)#19,260 |
| 38. | 78757 | 7.3% | 10.2%(-2.97)#1,306 | 9.6%(-2.34)#20,444 |
| 39. | 78754 | 7.0% | 10.2%(-3.19)#1,333 | 9.6%(-2.56)#21,078 |
| 40. | 78719 | 6.6% | 10.2%(-3.60)#1,378 | 9.6%(-2.97)#22,121 |
| 41. | 78751 | 5.8% | 10.2%(-4.37)#1,450 | 9.6%(-3.75)#23,976 |
| 42. | 78739 | 5.5% | 10.2%(-4.71)#1,493 | 9.6%(-4.08)#24,642 |
| 43. | 78722 | 4.5% | 10.2%(-5.68)#1,567 | 9.6%(-5.05)#26,284 |
1
Common Questions
What are the Top 10 Zip Codes with the Highest Percentage of Population Employed in Sales & Related in Austin, TX?
Top 10 Zip Codes with the Highest Percentage of Population Employed in Sales & Related in Austin, TX are:
What zip code has the Highest Percentage of Population Employed in Sales & Related in Austin, TX?
78742 has the Highest Percentage of Population Employed in Sales & Related in Austin, TX with 27.1%.
What is the Percentage of Population Employed in Sales & Related in Austin, TX?
Percentage of Population Employed in Sales & Related in Austin is 9.7%.
What is the Percentage of Population Employed in Sales & Related in Texas?
Percentage of Population Employed in Sales & Related in Texas is 10.2%.
What is the Percentage of Population Employed in Sales & Related in the United States?
Percentage of Population Employed in Sales & Related in the United States is 9.6%.