Zip Codes with the Highest Percentage of Households with Income Below $10,000 in Austin, TX
RELATED REPORTS & OPTIONS
Household Income | $0-10k
Austin
Compare Zip Codes
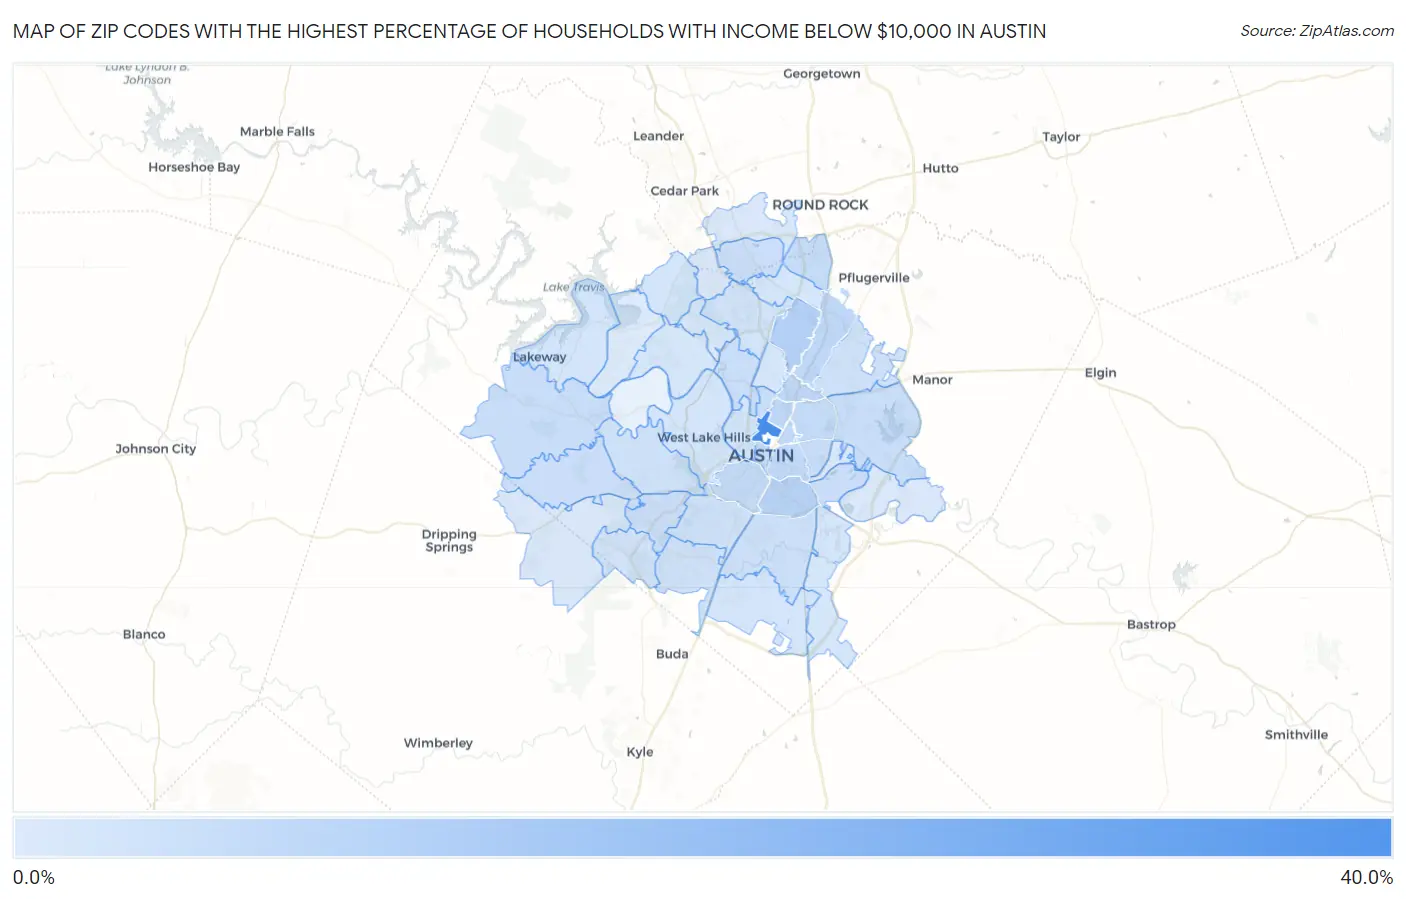
Map of Zip Codes with the Highest Percentage of Households with Income Below $10,000 in Austin
0.80%
32.9%
Zip Codes with the Highest Percentage of Households with Income Below $10,000 in Austin, TX
| Zip Code | Households with Income < $10k | vs State | vs National | |
| 1. | 78705 | 32.9% | 5.1%(+27.8)#13 | 4.9%(+28.0)#268 |
| 2. | 78758 | 8.7% | 5.1%(+3.60)#299 | 4.9%(+3.80)#4,714 |
| 3. | 78741 | 7.9% | 5.1%(+2.80)#374 | 4.9%(+3.00)#5,668 |
| 4. | 78752 | 6.9% | 5.1%(+1.80)#487 | 4.9%(+2.00)#7,121 |
| 5. | 78751 | 6.9% | 5.1%(+1.80)#488 | 4.9%(+2.00)#7,135 |
| 6. | 78753 | 6.7% | 5.1%(+1.60)#520 | 4.9%(+1.80)#7,515 |
| 7. | 78722 | 6.7% | 5.1%(+1.60)#525 | 4.9%(+1.80)#7,593 |
| 8. | 78702 | 6.0% | 5.1%(+0.900)#608 | 4.9%(+1.10)#9,004 |
| 9. | 78704 | 5.6% | 5.1%(+0.500)#668 | 4.9%(+0.700)#9,955 |
| 10. | 78723 | 5.5% | 5.1%(+0.400)#687 | 4.9%(+0.600)#10,212 |
| 11. | 78701 | 5.2% | 5.1%(+0.100)#739 | 4.9%(+0.300)#11,143 |
| 12. | 78728 | 5.0% | 5.1%(-0.100)#779 | 4.9%(+0.100)#11,698 |
| 13. | 78731 | 4.9% | 5.1%(-0.200)#803 | 4.9%(=0.000)#12,022 |
| 14. | 78756 | 4.8% | 5.1%(-0.300)#825 | 4.9%(-0.100)#12,397 |
| 15. | 78738 | 4.7% | 5.1%(-0.400)#836 | 4.9%(-0.200)#12,668 |
| 16. | 78724 | 4.7% | 5.1%(-0.400)#837 | 4.9%(-0.200)#12,670 |
| 17. | 78721 | 4.6% | 5.1%(-0.500)#856 | 4.9%(-0.300)#13,098 |
| 18. | 78729 | 4.2% | 5.1%(-0.900)#928 | 4.9%(-0.700)#14,484 |
| 19. | 78742 | 4.2% | 5.1%(-0.900)#942 | 4.9%(-0.700)#14,720 |
| 20. | 78749 | 4.1% | 5.1%(-1.00)#953 | 4.9%(-0.800)#14,839 |
| 21. | 78736 | 4.1% | 5.1%(-1.00)#966 | 4.9%(-0.800)#14,972 |
| 22. | 78744 | 3.9% | 5.1%(-1.20)#996 | 4.9%(-1.00)#15,590 |
| 23. | 78745 | 3.6% | 5.1%(-1.50)#1,068 | 4.9%(-1.30)#16,770 |
| 24. | 78754 | 3.6% | 5.1%(-1.50)#1,079 | 4.9%(-1.30)#16,838 |
| 25. | 78748 | 3.5% | 5.1%(-1.60)#1,097 | 4.9%(-1.40)#17,191 |
| 26. | 78735 | 3.5% | 5.1%(-1.60)#1,106 | 4.9%(-1.40)#17,297 |
| 27. | 78759 | 3.0% | 5.1%(-2.10)#1,198 | 4.9%(-1.90)#19,308 |
| 28. | 78739 | 2.8% | 5.1%(-2.30)#1,265 | 4.9%(-2.10)#20,329 |
| 29. | 78703 | 2.7% | 5.1%(-2.40)#1,282 | 4.9%(-2.20)#20,736 |
| 30. | 78747 | 2.7% | 5.1%(-2.40)#1,283 | 4.9%(-2.20)#20,743 |
| 31. | 78746 | 2.5% | 5.1%(-2.60)#1,328 | 4.9%(-2.40)#21,580 |
| 32. | 78734 | 2.5% | 5.1%(-2.60)#1,329 | 4.9%(-2.40)#21,606 |
| 33. | 78726 | 2.4% | 5.1%(-2.70)#1,353 | 4.9%(-2.50)#22,107 |
| 34. | 78730 | 2.3% | 5.1%(-2.80)#1,373 | 4.9%(-2.60)#22,547 |
| 35. | 78727 | 2.1% | 5.1%(-3.00)#1,409 | 4.9%(-2.80)#23,240 |
| 36. | 78757 | 2.0% | 5.1%(-3.10)#1,427 | 4.9%(-2.90)#23,630 |
| 37. | 78719 | 1.9% | 5.1%(-3.20)#1,462 | 4.9%(-3.00)#24,222 |
| 38. | 78737 | 1.7% | 5.1%(-3.40)#1,498 | 4.9%(-3.20)#24,724 |
| 39. | 78717 | 1.4% | 5.1%(-3.70)#1,536 | 4.9%(-3.50)#25,705 |
| 40. | 78750 | 1.3% | 5.1%(-3.80)#1,551 | 4.9%(-3.60)#26,012 |
| 41. | 78725 | 1.3% | 5.1%(-3.80)#1,555 | 4.9%(-3.60)#26,067 |
| 42. | 78732 | 0.80% | 5.1%(-4.30)#1,619 | 4.9%(-4.10)#27,254 |
1
Common Questions
What are the Top 10 Zip Codes with the Highest Percentage of Households with Income Below $10,000 in Austin, TX?
Top 10 Zip Codes with the Highest Percentage of Households with Income Below $10,000 in Austin, TX are:
What zip code has the Highest Percentage of Households with Income Below $10,000 in Austin, TX?
78705 has the Highest Percentage of Households with Income Below $10,000 in Austin, TX with 32.9%.
What is the Percentage of Households with Income Below $10,000 in Austin, TX?
Percentage of Households with Income Below $10,000 in Austin is 5.2%.
What is the Percentage of Households with Income Below $10,000 in Texas?
Percentage of Households with Income Below $10,000 in Texas is 5.1%.
What is the Percentage of Households with Income Below $10,000 in the United States?
Percentage of Households with Income Below $10,000 in the United States is 4.9%.