Zip Codes with the Highest Percentage of Population Employed in Legal Services & Support in Austin, TX
RELATED REPORTS & OPTIONS
Legal Services & Support
Austin
Compare Zip Codes
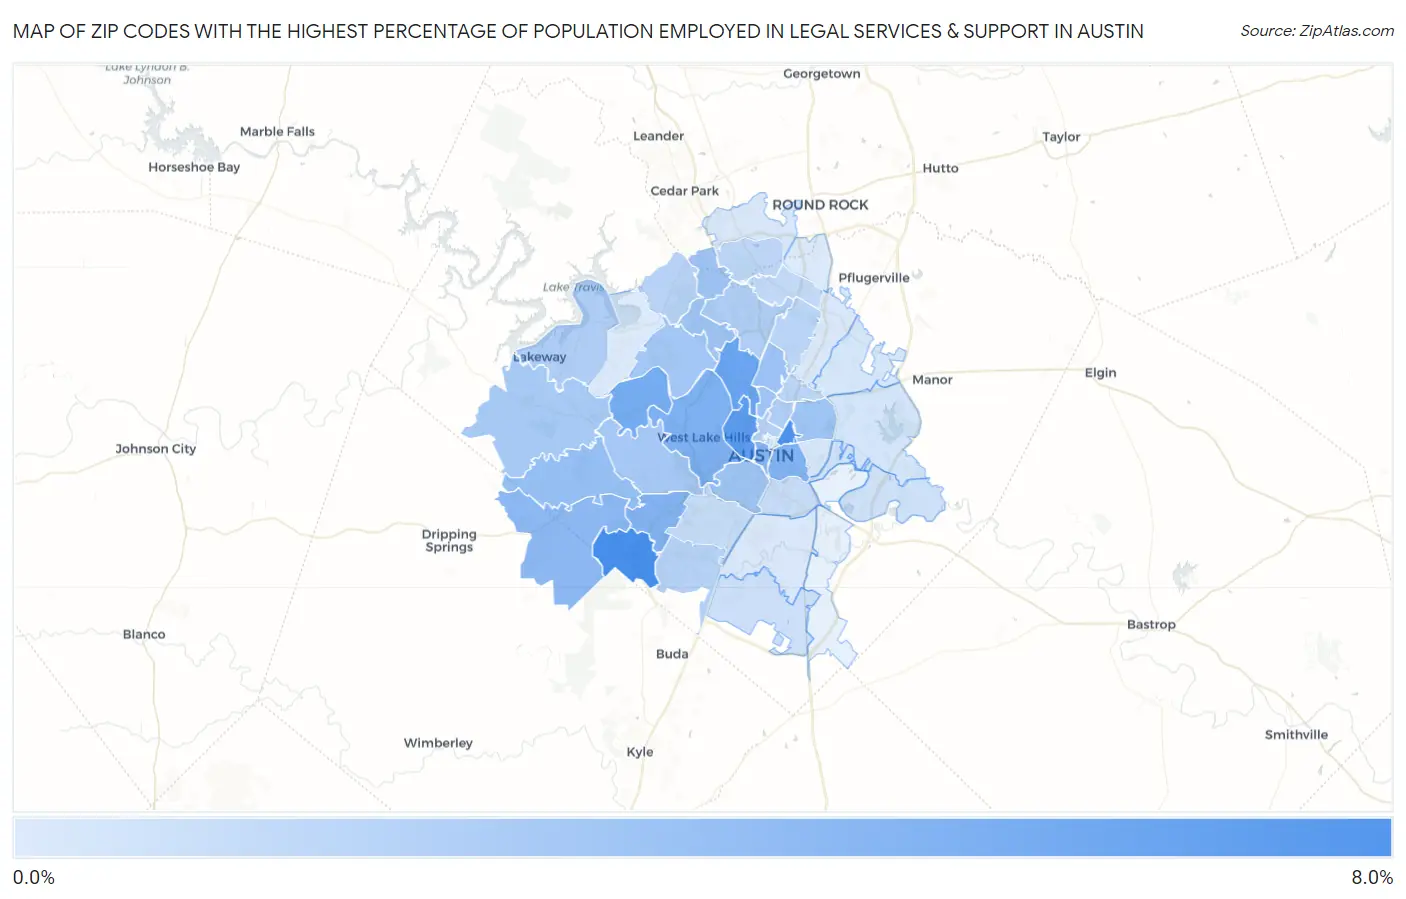
Map of Zip Codes with the Highest Percentage of Population Employed in Legal Services & Support in Austin
0.23%
6.6%
Zip Codes with the Highest Percentage of Population Employed in Legal Services & Support in Austin, TX
| Zip Code | % Employed | vs State | vs National | |
| 1. | 78739 | 6.6% | 1.0%(+5.62)#19 | 1.2%(+5.44)#385 |
| 2. | 78722 | 6.4% | 1.0%(+5.37)#21 | 1.2%(+5.19)#412 |
| 3. | 78703 | 5.8% | 1.0%(+4.84)#24 | 1.2%(+4.66)#520 |
| 4. | 78731 | 5.1% | 1.0%(+4.12)#31 | 1.2%(+3.94)#687 |
| 5. | 78733 | 4.6% | 1.0%(+3.59)#41 | 1.2%(+3.41)#855 |
| 6. | 78746 | 4.2% | 1.0%(+3.22)#45 | 1.2%(+3.04)#1,013 |
| 7. | 78702 | 4.1% | 1.0%(+3.07)#52 | 1.2%(+2.90)#1,092 |
| 8. | 78749 | 4.0% | 1.0%(+3.01)#54 | 1.2%(+2.83)#1,118 |
| 9. | 78701 | 3.9% | 1.0%(+2.93)#55 | 1.2%(+2.76)#1,155 |
| 10. | 78737 | 3.6% | 1.0%(+2.61)#68 | 1.2%(+2.44)#1,335 |
| 11. | 78736 | 3.2% | 1.0%(+2.20)#88 | 1.2%(+2.02)#1,644 |
| 12. | 78757 | 3.1% | 1.0%(+2.05)#98 | 1.2%(+1.87)#1,795 |
| 13. | 78756 | 2.9% | 1.0%(+1.86)#108 | 1.2%(+1.68)#2,007 |
| 14. | 78704 | 2.8% | 1.0%(+1.79)#114 | 1.2%(+1.62)#2,084 |
| 15. | 78723 | 2.8% | 1.0%(+1.78)#115 | 1.2%(+1.61)#2,095 |
| 16. | 78750 | 2.8% | 1.0%(+1.76)#116 | 1.2%(+1.58)#2,119 |
| 17. | 78730 | 2.6% | 1.0%(+1.59)#131 | 1.2%(+1.42)#2,350 |
| 18. | 78735 | 2.6% | 1.0%(+1.58)#132 | 1.2%(+1.40)#2,378 |
| 19. | 78738 | 2.4% | 1.0%(+1.43)#142 | 1.2%(+1.26)#2,607 |
| 20. | 78734 | 2.1% | 1.0%(+1.14)#162 | 1.2%(+0.964)#3,144 |
| 21. | 78759 | 2.1% | 1.0%(+1.14)#163 | 1.2%(+0.963)#3,148 |
| 22. | 78751 | 2.1% | 1.0%(+1.12)#165 | 1.2%(+0.945)#3,184 |
| 23. | 78705 | 1.9% | 1.0%(+0.862)#204 | 1.2%(+0.686)#3,813 |
| 24. | 78748 | 1.8% | 1.0%(+0.821)#212 | 1.2%(+0.645)#3,918 |
| 25. | 78726 | 1.8% | 1.0%(+0.753)#221 | 1.2%(+0.577)#4,107 |
| 26. | 78752 | 1.7% | 1.0%(+0.699)#233 | 1.2%(+0.523)#4,294 |
| 27. | 78758 | 1.6% | 1.0%(+0.618)#240 | 1.2%(+0.442)#4,587 |
| 28. | 78729 | 1.6% | 1.0%(+0.596)#245 | 1.2%(+0.421)#4,657 |
| 29. | 78727 | 1.4% | 1.0%(+0.397)#295 | 1.2%(+0.221)#5,447 |
| 30. | 78745 | 1.2% | 1.0%(+0.171)#359 | 1.2%(-0.005)#6,655 |
| 31. | 78741 | 1.1% | 1.0%(+0.069)#400 | 1.2%(-0.106)#7,324 |
| 32. | 78747 | 0.91% | 1.0%(-0.096)#474 | 1.2%(-0.271)#8,496 |
| 33. | 78725 | 0.81% | 1.0%(-0.199)#521 | 1.2%(-0.374)#9,363 |
| 34. | 78724 | 0.62% | 1.0%(-0.390)#669 | 1.2%(-0.566)#11,270 |
| 35. | 78721 | 0.54% | 1.0%(-0.472)#718 | 1.2%(-0.648)#12,195 |
| 36. | 78754 | 0.48% | 1.0%(-0.524)#769 | 1.2%(-0.700)#12,838 |
| 37. | 78717 | 0.47% | 1.0%(-0.539)#788 | 1.2%(-0.715)#13,023 |
| 38. | 78744 | 0.34% | 1.0%(-0.672)#898 | 1.2%(-0.847)#14,622 |
| 39. | 78753 | 0.29% | 1.0%(-0.716)#930 | 1.2%(-0.892)#15,135 |
| 40. | 78728 | 0.25% | 1.0%(-0.756)#962 | 1.2%(-0.932)#15,607 |
| 41. | 78732 | 0.23% | 1.0%(-0.777)#978 | 1.2%(-0.953)#15,856 |
1
Common Questions
What are the Top 10 Zip Codes with the Highest Percentage of Population Employed in Legal Services & Support in Austin, TX?
Top 10 Zip Codes with the Highest Percentage of Population Employed in Legal Services & Support in Austin, TX are:
What zip code has the Highest Percentage of Population Employed in Legal Services & Support in Austin, TX?
78739 has the Highest Percentage of Population Employed in Legal Services & Support in Austin, TX with 6.6%.
What is the Percentage of Population Employed in Legal Services & Support in Austin, TX?
Percentage of Population Employed in Legal Services & Support in Austin is 2.1%.
What is the Percentage of Population Employed in Legal Services & Support in Texas?
Percentage of Population Employed in Legal Services & Support in Texas is 1.0%.
What is the Percentage of Population Employed in Legal Services & Support in the United States?
Percentage of Population Employed in Legal Services & Support in the United States is 1.2%.