Zip Codes with the Highest Percentage of Population with a Degree in Visual and Performing Arts in Austin, TX
RELATED REPORTS & OPTIONS
Visual and Performing Arts
Austin
Compare Zip Codes
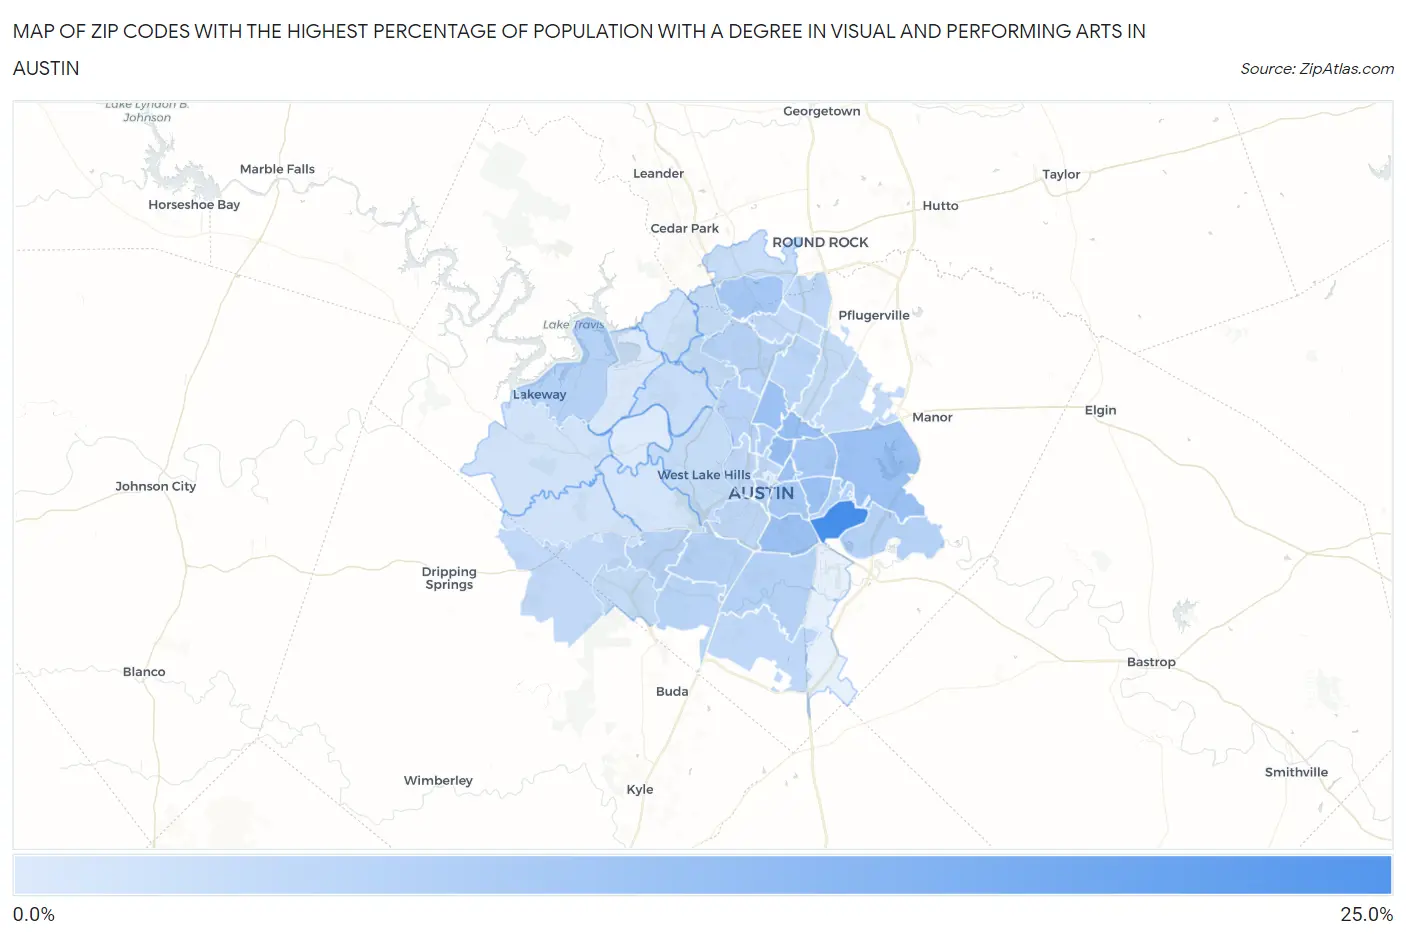
Map of Zip Codes with the Highest Percentage of Population with a Degree in Visual and Performing Arts in Austin
1.2%
22.2%
Zip Codes with the Highest Percentage of Population with a Degree in Visual and Performing Arts in Austin, TX
| Zip Code | % Graduates | vs State | vs National | |
| 1. | 78742 | 22.2% | 3.2%(+19.0)#19 | 4.3%(+18.0)#386 |
| 2. | 78751 | 10.9% | 3.2%(+7.66)#50 | 4.3%(+6.61)#1,574 |
| 3. | 78752 | 10.5% | 3.2%(+7.28)#53 | 4.3%(+6.24)#1,679 |
| 4. | 78724 | 10.1% | 3.2%(+6.84)#57 | 4.3%(+5.80)#1,808 |
| 5. | 78741 | 10.0% | 3.2%(+6.84)#58 | 4.3%(+5.79)#1,809 |
| 6. | 78757 | 10.0% | 3.2%(+6.80)#59 | 4.3%(+5.75)#1,821 |
| 7. | 78721 | 9.8% | 3.2%(+6.62)#64 | 4.3%(+5.58)#1,897 |
| 8. | 78722 | 9.7% | 3.2%(+6.48)#67 | 4.3%(+5.44)#1,946 |
| 9. | 78729 | 8.6% | 3.2%(+5.39)#85 | 4.3%(+4.34)#2,476 |
| 10. | 78723 | 8.4% | 3.2%(+5.19)#92 | 4.3%(+4.15)#2,602 |
| 11. | 78702 | 8.2% | 3.2%(+5.00)#97 | 4.3%(+3.96)#2,717 |
| 12. | 78756 | 7.3% | 3.2%(+4.08)#118 | 4.3%(+3.04)#3,380 |
| 13. | 78745 | 6.5% | 3.2%(+3.29)#159 | 4.3%(+2.24)#4,228 |
| 14. | 78725 | 6.5% | 3.2%(+3.28)#160 | 4.3%(+2.24)#4,236 |
| 15. | 78734 | 6.5% | 3.2%(+3.27)#161 | 4.3%(+2.23)#4,247 |
| 16. | 78701 | 6.3% | 3.2%(+3.11)#174 | 4.3%(+2.06)#4,451 |
| 17. | 78744 | 6.3% | 3.2%(+3.08)#176 | 4.3%(+2.04)#4,473 |
| 18. | 78749 | 6.2% | 3.2%(+2.98)#187 | 4.3%(+1.94)#4,610 |
| 19. | 78759 | 6.2% | 3.2%(+2.98)#188 | 4.3%(+1.93)#4,617 |
| 20. | 78731 | 6.1% | 3.2%(+2.88)#193 | 4.3%(+1.84)#4,749 |
| 21. | 78748 | 5.7% | 3.2%(+2.52)#218 | 4.3%(+1.48)#5,285 |
| 22. | 78758 | 5.7% | 3.2%(+2.46)#220 | 4.3%(+1.42)#5,381 |
| 23. | 78728 | 5.2% | 3.2%(+2.03)#257 | 4.3%(+0.985)#6,170 |
| 24. | 78704 | 5.2% | 3.2%(+2.01)#259 | 4.3%(+0.968)#6,205 |
| 25. | 78747 | 5.1% | 3.2%(+1.93)#266 | 4.3%(+0.891)#6,350 |
| 26. | 78705 | 5.1% | 3.2%(+1.85)#275 | 4.3%(+0.803)#6,514 |
| 27. | 78727 | 5.0% | 3.2%(+1.74)#283 | 4.3%(+0.700)#6,758 |
| 28. | 78703 | 4.8% | 3.2%(+1.57)#295 | 4.3%(+0.532)#7,105 |
| 29. | 78737 | 4.8% | 3.2%(+1.57)#297 | 4.3%(+0.530)#7,110 |
| 30. | 78754 | 4.6% | 3.2%(+1.41)#317 | 4.3%(+0.367)#7,503 |
| 31. | 78753 | 4.5% | 3.2%(+1.30)#332 | 4.3%(+0.261)#7,773 |
| 32. | 78746 | 4.2% | 3.2%(+1.04)#367 | 4.3%(-0.005)#8,496 |
| 33. | 78750 | 4.1% | 3.2%(+0.912)#398 | 4.3%(-0.131)#8,867 |
| 34. | 78739 | 4.1% | 3.2%(+0.870)#403 | 4.3%(-0.172)#9,007 |
| 35. | 78730 | 4.0% | 3.2%(+0.797)#418 | 4.3%(-0.246)#9,243 |
| 36. | 78717 | 3.8% | 3.2%(+0.590)#448 | 4.3%(-0.453)#9,856 |
| 37. | 78726 | 3.1% | 3.2%(-0.118)#580 | 4.3%(-1.16)#12,369 |
| 38. | 78738 | 2.7% | 3.2%(-0.536)#680 | 4.3%(-1.58)#14,007 |
| 39. | 78736 | 2.6% | 3.2%(-0.599)#694 | 4.3%(-1.64)#14,231 |
| 40. | 78735 | 2.3% | 3.2%(-0.915)#783 | 4.3%(-1.96)#15,393 |
| 41. | 78732 | 1.5% | 3.2%(-1.71)#991 | 4.3%(-2.75)#18,150 |
| 42. | 78733 | 1.2% | 3.2%(-1.98)#1,055 | 4.3%(-3.02)#18,967 |
1
Common Questions
What are the Top 10 Zip Codes with the Highest Percentage of Population with a Degree in Visual and Performing Arts in Austin, TX?
Top 10 Zip Codes with the Highest Percentage of Population with a Degree in Visual and Performing Arts in Austin, TX are:
What zip code has the Highest Percentage of Population with a Degree in Visual and Performing Arts in Austin, TX?
78742 has the Highest Percentage of Population with a Degree in Visual and Performing Arts in Austin, TX with 22.2%.
What is the Percentage of Population with a Degree in Visual and Performing Arts in Austin, TX?
Percentage of Population with a Degree in Visual and Performing Arts in Austin is 6.2%.
What is the Percentage of Population with a Degree in Visual and Performing Arts in Texas?
Percentage of Population with a Degree in Visual and Performing Arts in Texas is 3.2%.
What is the Percentage of Population with a Degree in Visual and Performing Arts in the United States?
Percentage of Population with a Degree in Visual and Performing Arts in the United States is 4.3%.