Zip Codes with the Largest Hispanic or Latino Community in Austin, TX
RELATED REPORTS & OPTIONS
Hispanic or Latino
Austin
Compare Zip Codes
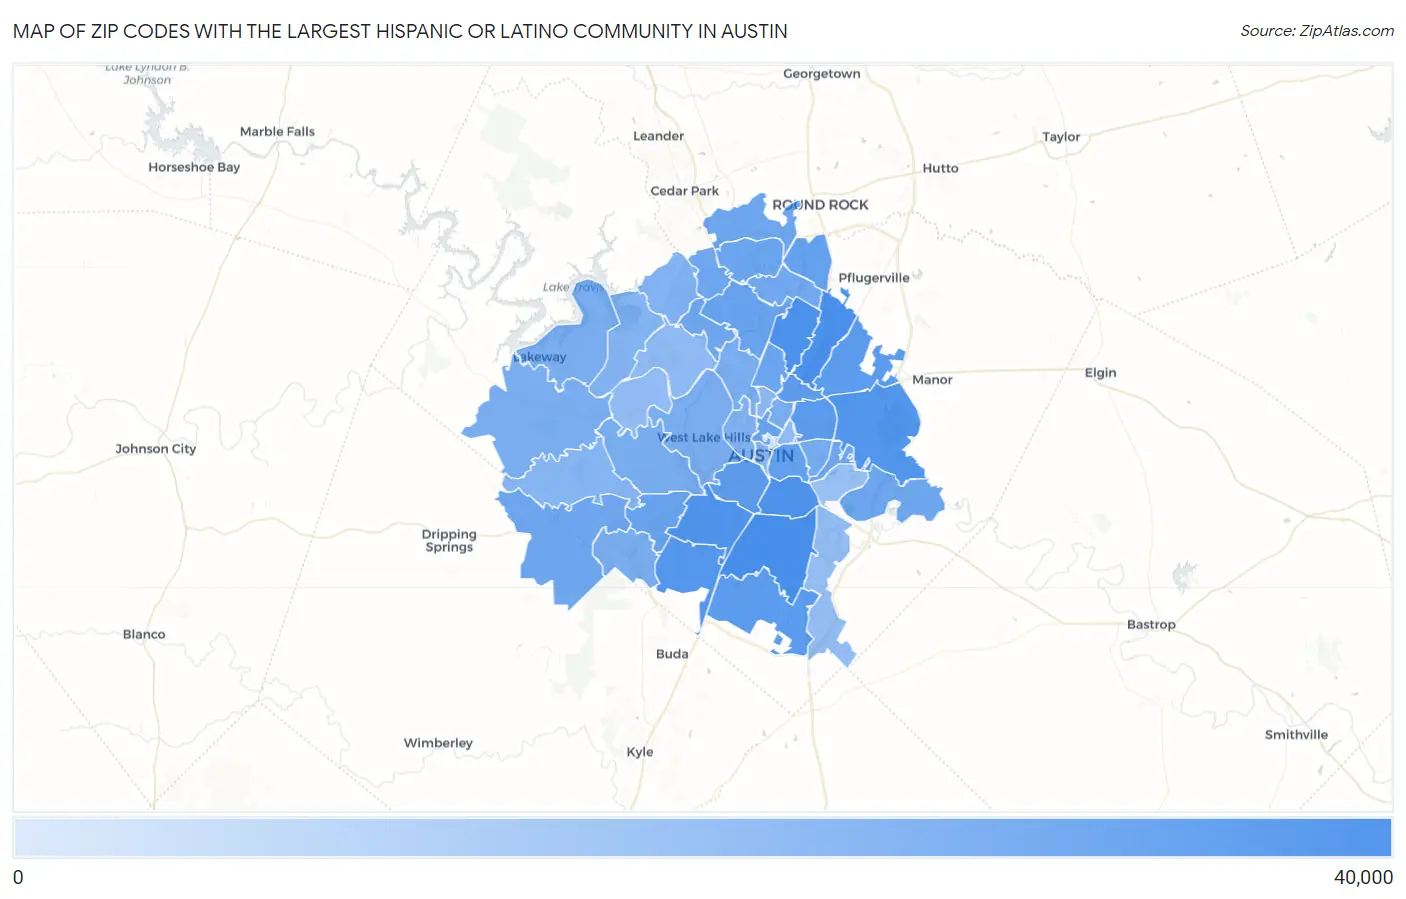
Map of Zip Codes with the Largest Hispanic or Latino Community in Austin
39
32,139
Zip Codes with the Largest Hispanic or Latino Community in Austin, TX
| Zip Code | Hispanic or Latino | vs State | vs National | |
| 1. | 78744 | 32,139 | 11,665,280(0.28%)#72 | 61,755,866(0.05%)#331 |
| 2. | 78753 | 30,165 | 11,665,280(0.26%)#83 | 61,755,866(0.05%)#382 |
| 3. | 78758 | 24,910 | 11,665,280(0.21%)#114 | 61,755,866(0.04%)#526 |
| 4. | 78745 | 23,117 | 11,665,280(0.20%)#124 | 61,755,866(0.04%)#596 |
| 5. | 78741 | 22,610 | 11,665,280(0.19%)#132 | 61,755,866(0.04%)#620 |
| 6. | 78724 | 19,041 | 11,665,280(0.16%)#173 | 61,755,866(0.03%)#798 |
| 7. | 78748 | 17,475 | 11,665,280(0.15%)#196 | 61,755,866(0.03%)#889 |
| 8. | 78723 | 13,390 | 11,665,280(0.11%)#276 | 61,755,866(0.02%)#1,250 |
| 9. | 78754 | 12,829 | 11,665,280(0.11%)#292 | 61,755,866(0.02%)#1,309 |
| 10. | 78704 | 12,670 | 11,665,280(0.11%)#301 | 61,755,866(0.02%)#1,333 |
| 11. | 78747 | 12,149 | 11,665,280(0.10%)#312 | 61,755,866(0.02%)#1,393 |
| 12. | 78752 | 10,988 | 11,665,280(0.09%)#341 | 61,755,866(0.02%)#1,533 |
| 13. | 78702 | 8,902 | 11,665,280(0.08%)#401 | 61,755,866(0.01%)#1,904 |
| 14. | 78728 | 8,368 | 11,665,280(0.07%)#436 | 61,755,866(0.01%)#2,035 |
| 15. | 78705 | 7,095 | 11,665,280(0.06%)#486 | 61,755,866(0.01%)#2,376 |
| 16. | 78749 | 6,871 | 11,665,280(0.06%)#497 | 61,755,866(0.01%)#2,441 |
| 17. | 78759 | 6,656 | 11,665,280(0.06%)#506 | 61,755,866(0.01%)#2,503 |
| 18. | 78757 | 6,320 | 11,665,280(0.05%)#522 | 61,755,866(0.01%)#2,610 |
| 19. | 78729 | 6,291 | 11,665,280(0.05%)#523 | 61,755,866(0.01%)#2,615 |
| 20. | 78717 | 5,579 | 11,665,280(0.05%)#574 | 61,755,866(0.01%)#2,907 |
| 21. | 78737 | 5,478 | 11,665,280(0.05%)#580 | 61,755,866(0.01%)#2,942 |
| 22. | 78725 | 5,477 | 11,665,280(0.05%)#581 | 61,755,866(0.01%)#2,944 |
| 23. | 78727 | 5,111 | 11,665,280(0.04%)#605 | 61,755,866(0.01%)#3,114 |
| 24. | 78750 | 5,102 | 11,665,280(0.04%)#607 | 61,755,866(0.01%)#3,117 |
| 25. | 78721 | 4,006 | 11,665,280(0.03%)#687 | 61,755,866(0.01%)#3,734 |
| 26. | 78735 | 3,882 | 11,665,280(0.03%)#697 | 61,755,866(0.01%)#3,818 |
| 27. | 78751 | 3,606 | 11,665,280(0.03%)#720 | 61,755,866(0.01%)#4,026 |
| 28. | 78738 | 3,483 | 11,665,280(0.03%)#731 | 61,755,866(0.01%)#4,123 |
| 29. | 78746 | 3,383 | 11,665,280(0.03%)#737 | 61,755,866(0.01%)#4,211 |
| 30. | 78731 | 3,362 | 11,665,280(0.03%)#741 | 61,755,866(0.01%)#4,231 |
| 31. | 78734 | 3,236 | 11,665,280(0.03%)#756 | 61,755,866(0.01%)#4,351 |
| 32. | 78739 | 3,207 | 11,665,280(0.03%)#761 | 61,755,866(0.01%)#4,381 |
| 33. | 78726 | 2,545 | 11,665,280(0.02%)#819 | 61,755,866(0.00%)#5,031 |
| 34. | 78703 | 2,493 | 11,665,280(0.02%)#826 | 61,755,866(0.00%)#5,106 |
| 35. | 78732 | 2,220 | 11,665,280(0.02%)#858 | 61,755,866(0.00%)#5,457 |
| 36. | 78736 | 2,006 | 11,665,280(0.02%)#885 | 61,755,866(0.00%)#5,789 |
| 37. | 78701 | 1,762 | 11,665,280(0.02%)#913 | 61,755,866(0.00%)#6,223 |
| 38. | 78756 | 1,658 | 11,665,280(0.01%)#928 | 61,755,866(0.00%)#6,412 |
| 39. | 78722 | 1,388 | 11,665,280(0.01%)#969 | 61,755,866(0.00%)#7,034 |
| 40. | 78730 | 1,382 | 11,665,280(0.01%)#971 | 61,755,866(0.00%)#7,051 |
| 41. | 78733 | 1,243 | 11,665,280(0.01%)#1,000 | 61,755,866(0.00%)#7,412 |
| 42. | 78719 | 1,116 | 11,665,280(0.01%)#1,029 | 61,755,866(0.00%)#7,772 |
| 43. | 78742 | 907 | 11,665,280(0.01%)#1,082 | 61,755,866(0.00%)#8,578 |
| 44. | 78712 | 39 | 11,665,280(0.00%)#1,685 | 61,755,866(0.00%)#20,537 |
1
Common Questions
What are the Top 10 Zip Codes with the Largest Hispanic or Latino Community in Austin, TX?
Top 10 Zip Codes with the Largest Hispanic or Latino Community in Austin, TX are:
What zip code has the Largest Hispanic or Latino Community in Austin, TX?
78744 has the Largest Hispanic or Latino Community in Austin, TX with 32,139.
What is the Total Hispanic or Latino Population in Austin, TX?
Total Hispanic or Latino Population in Austin is 311,884.
What is the Total Hispanic or Latino Population in Texas?
Total Hispanic or Latino Population in Texas is 11,665,280.
What is the Total Hispanic or Latino Population in the United States?
Total Hispanic or Latino Population in the United States is 61,755,866.