Zip Codes with the Highest Percentage of Families with Income Above $200,000 in Austin, TX
RELATED REPORTS & OPTIONS
Family Income | $200k+
Austin
Compare Zip Codes
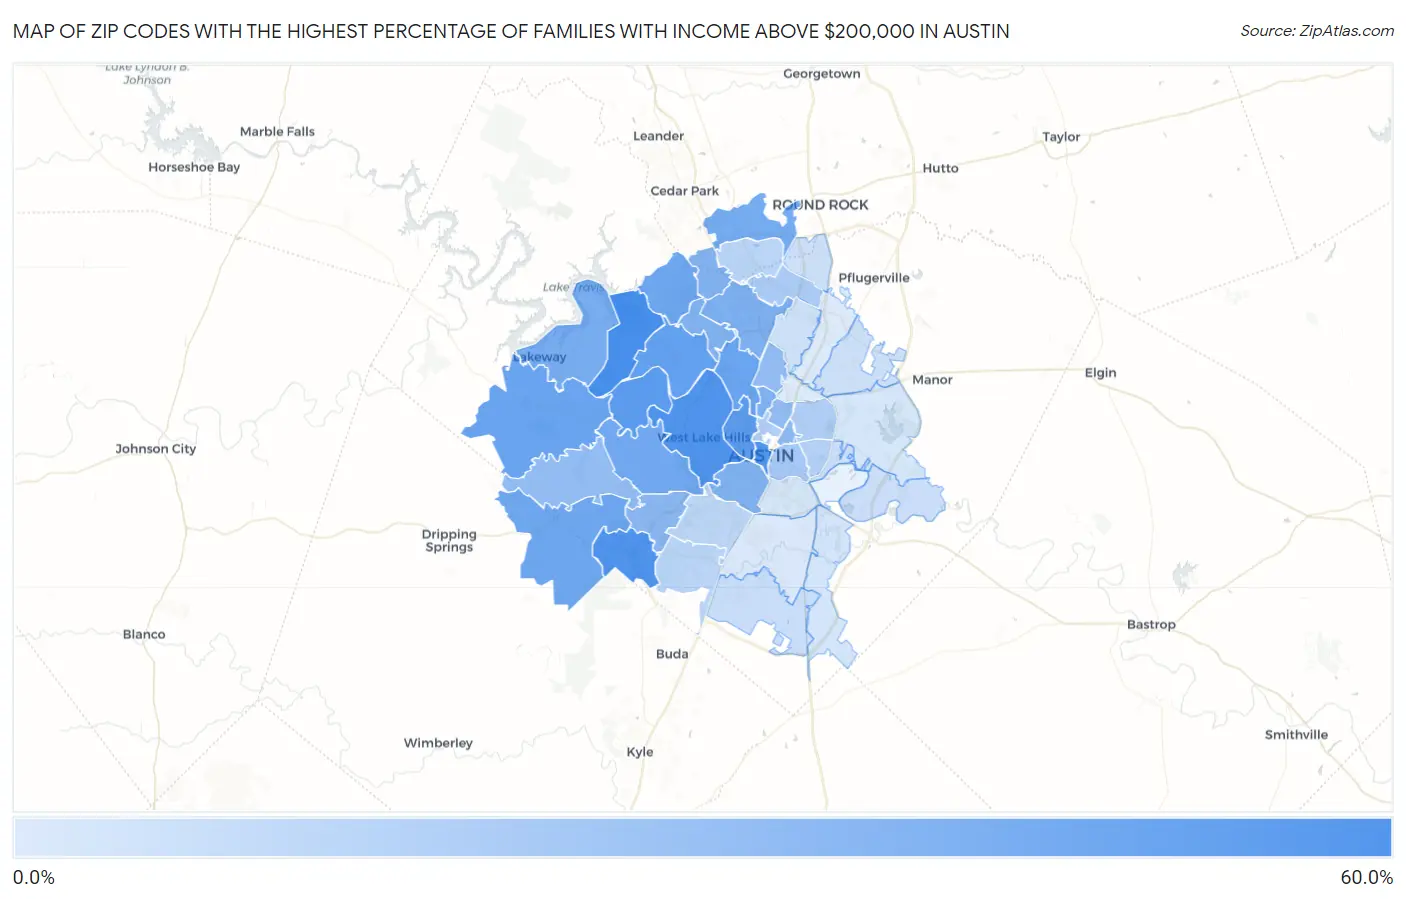
Map of Zip Codes with the Highest Percentage of Families with Income Above $200,000 in Austin
4.9%
59.0%
Zip Codes with the Highest Percentage of Families with Income Above $200,000 in Austin, TX
| Zip Code | Families with Income > $200k | vs State | vs National | |
| 1. | 78732 | 59.0% | 13.5%(+45.5)#13 | 14.8%(+44.2)#321 |
| 2. | 78739 | 56.2% | 13.5%(+42.7)#14 | 14.8%(+41.4)#408 |
| 3. | 78746 | 55.4% | 13.5%(+41.9)#17 | 14.8%(+40.6)#441 |
| 4. | 78701 | 54.3% | 13.5%(+40.8)#21 | 14.8%(+39.5)#490 |
| 5. | 78733 | 51.5% | 13.5%(+38.0)#25 | 14.8%(+36.7)#592 |
| 6. | 78703 | 50.4% | 13.5%(+36.9)#29 | 14.8%(+35.6)#644 |
| 7. | 78730 | 47.1% | 13.5%(+33.6)#32 | 14.8%(+32.3)#813 |
| 8. | 78738 | 44.8% | 13.5%(+31.3)#38 | 14.8%(+30.0)#946 |
| 9. | 78731 | 44.5% | 13.5%(+31.0)#40 | 14.8%(+29.7)#959 |
| 10. | 78726 | 42.6% | 13.5%(+29.1)#43 | 14.8%(+27.8)#1,079 |
| 11. | 78737 | 42.5% | 13.5%(+29.0)#45 | 14.8%(+27.7)#1,092 |
| 12. | 78735 | 41.6% | 13.5%(+28.1)#49 | 14.8%(+26.8)#1,180 |
| 13. | 78717 | 39.7% | 13.5%(+26.2)#60 | 14.8%(+24.9)#1,335 |
| 14. | 78734 | 39.1% | 13.5%(+25.6)#66 | 14.8%(+24.3)#1,402 |
| 15. | 78756 | 36.1% | 13.5%(+22.6)#75 | 14.8%(+21.3)#1,720 |
| 16. | 78759 | 36.0% | 13.5%(+22.5)#76 | 14.8%(+21.2)#1,723 |
| 17. | 78704 | 35.6% | 13.5%(+22.1)#77 | 14.8%(+20.8)#1,765 |
| 18. | 78750 | 34.5% | 13.5%(+21.0)#88 | 14.8%(+19.7)#1,903 |
| 19. | 78749 | 31.7% | 13.5%(+18.2)#105 | 14.8%(+16.9)#2,266 |
| 20. | 78722 | 31.6% | 13.5%(+18.1)#107 | 14.8%(+16.8)#2,288 |
| 21. | 78751 | 29.4% | 13.5%(+15.9)#121 | 14.8%(+14.6)#2,602 |
| 22. | 78757 | 28.6% | 13.5%(+15.1)#134 | 14.8%(+13.8)#2,749 |
| 23. | 78736 | 28.4% | 13.5%(+14.9)#136 | 14.8%(+13.6)#2,799 |
| 24. | 78702 | 22.2% | 13.5%(+8.70)#213 | 14.8%(+7.40)#4,158 |
| 25. | 78727 | 20.9% | 13.5%(+7.40)#233 | 14.8%(+6.10)#4,532 |
| 26. | 78723 | 19.1% | 13.5%(+5.60)#262 | 14.8%(+4.30)#5,103 |
| 27. | 78705 | 18.5% | 13.5%(+5.00)#275 | 14.8%(+3.70)#5,359 |
| 28. | 78721 | 17.6% | 13.5%(+4.10)#295 | 14.8%(+2.80)#5,736 |
| 29. | 78748 | 15.5% | 13.5%(+2.00)#342 | 14.8%(+0.700)#6,679 |
| 30. | 78729 | 15.4% | 13.5%(+1.90)#348 | 14.8%(+0.600)#6,732 |
| 31. | 78745 | 14.8% | 13.5%(+1.30)#367 | 14.8%(=0.000)#7,074 |
| 32. | 78747 | 11.0% | 13.5%(-2.50)#552 | 14.8%(-3.80)#9,819 |
| 33. | 78725 | 10.6% | 13.5%(-2.90)#596 | 14.8%(-4.20)#10,220 |
| 34. | 78754 | 9.9% | 13.5%(-3.60)#646 | 14.8%(-4.90)#10,898 |
| 35. | 78728 | 9.4% | 13.5%(-4.10)#681 | 14.8%(-5.40)#11,419 |
| 36. | 78758 | 9.3% | 13.5%(-4.20)#683 | 14.8%(-5.50)#11,516 |
| 37. | 78719 | 7.6% | 13.5%(-5.90)#827 | 14.8%(-7.20)#13,820 |
| 38. | 78724 | 7.1% | 13.5%(-6.40)#873 | 14.8%(-7.70)#14,478 |
| 39. | 78741 | 6.9% | 13.5%(-6.60)#890 | 14.8%(-7.90)#14,839 |
| 40. | 78744 | 5.4% | 13.5%(-8.10)#1,029 | 14.8%(-9.40)#17,563 |
| 41. | 78753 | 5.0% | 13.5%(-8.50)#1,084 | 14.8%(-9.80)#18,391 |
| 42. | 78752 | 4.9% | 13.5%(-8.60)#1,097 | 14.8%(-9.90)#18,615 |
1
Common Questions
What are the Top 10 Zip Codes with the Highest Percentage of Families with Income Above $200,000 in Austin, TX?
Top 10 Zip Codes with the Highest Percentage of Families with Income Above $200,000 in Austin, TX are:
What zip code has the Highest Percentage of Families with Income Above $200,000 in Austin, TX?
78732 has the Highest Percentage of Families with Income Above $200,000 in Austin, TX with 59.0%.
What is the Percentage of Families with Income Above $200,000 in Austin, TX?
Percentage of Families with Income Above $200,000 in Austin is 23.5%.
What is the Percentage of Families with Income Above $200,000 in Texas?
Percentage of Families with Income Above $200,000 in Texas is 13.5%.
What is the Percentage of Families with Income Above $200,000 in the United States?
Percentage of Families with Income Above $200,000 in the United States is 14.8%.