Zip Codes with the Highest Percentage of Population with a Degree in Psychology in Austin, TX
RELATED REPORTS & OPTIONS
Psychology
Austin
Compare Zip Codes
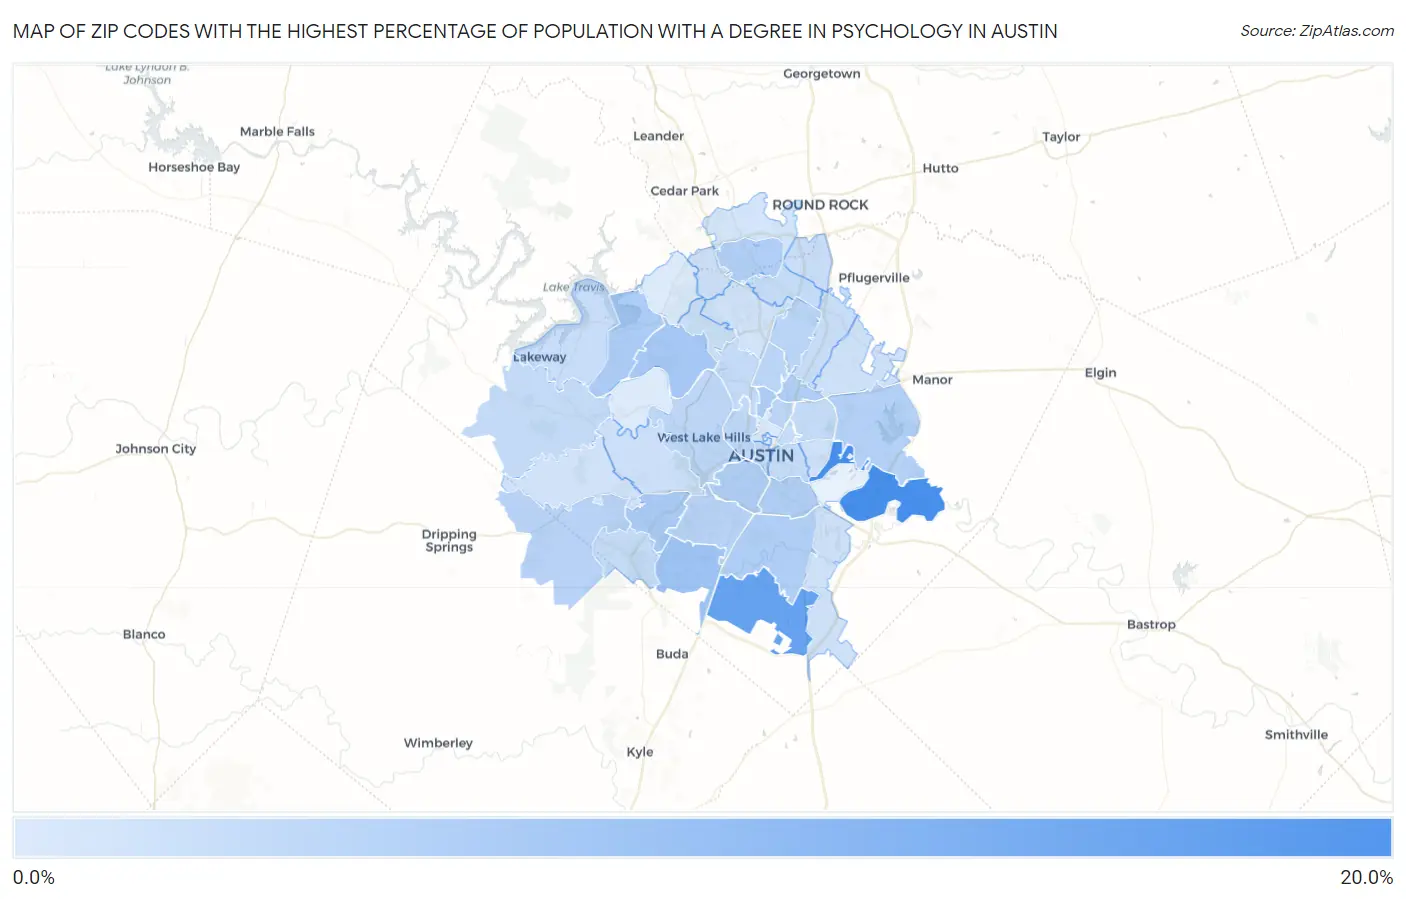
Map of Zip Codes with the Highest Percentage of Population with a Degree in Psychology in Austin
2.3%
15.0%
Zip Codes with the Highest Percentage of Population with a Degree in Psychology in Austin, TX
| Zip Code | % Graduates | vs State | vs National | |
| 1. | 78725 | 15.0% | 4.3%(+10.7)#43 | 5.1%(+9.99)#1,126 |
| 2. | 78747 | 12.4% | 4.3%(+8.10)#67 | 5.1%(+7.35)#1,629 |
| 3. | 78748 | 7.5% | 4.3%(+3.17)#205 | 5.1%(+2.41)#4,885 |
| 4. | 78730 | 6.8% | 4.3%(+2.45)#238 | 5.1%(+1.70)#6,100 |
| 5. | 78749 | 6.5% | 4.3%(+2.20)#257 | 5.1%(+1.45)#6,656 |
| 6. | 78756 | 6.4% | 4.3%(+2.07)#275 | 5.1%(+1.32)#6,969 |
| 7. | 78732 | 6.2% | 4.3%(+1.91)#291 | 5.1%(+1.16)#7,349 |
| 8. | 78704 | 6.0% | 4.3%(+1.68)#310 | 5.1%(+0.924)#8,012 |
| 9. | 78744 | 5.9% | 4.3%(+1.64)#319 | 5.1%(+0.885)#8,148 |
| 10. | 78752 | 5.9% | 4.3%(+1.62)#323 | 5.1%(+0.866)#8,202 |
| 11. | 78729 | 5.8% | 4.3%(+1.52)#337 | 5.1%(+0.763)#8,528 |
| 12. | 78741 | 5.8% | 4.3%(+1.51)#338 | 5.1%(+0.761)#8,534 |
| 13. | 78724 | 5.6% | 4.3%(+1.28)#365 | 5.1%(+0.530)#9,246 |
| 14. | 78745 | 5.3% | 4.3%(+1.05)#403 | 5.1%(+0.296)#10,009 |
| 15. | 78737 | 5.3% | 4.3%(+1.04)#405 | 5.1%(+0.284)#10,041 |
| 16. | 78751 | 5.1% | 4.3%(+0.833)#442 | 5.1%(+0.081)#10,773 |
| 17. | 78757 | 5.0% | 4.3%(+0.724)#461 | 5.1%(-0.029)#11,189 |
| 18. | 78758 | 5.0% | 4.3%(+0.722)#462 | 5.1%(-0.030)#11,195 |
| 19. | 78746 | 4.9% | 4.3%(+0.580)#488 | 5.1%(-0.173)#11,697 |
| 20. | 78703 | 4.8% | 4.3%(+0.492)#506 | 5.1%(-0.261)#11,982 |
| 21. | 78731 | 4.4% | 4.3%(+0.117)#592 | 5.1%(-0.635)#13,420 |
| 22. | 78723 | 4.4% | 4.3%(+0.088)#602 | 5.1%(-0.665)#13,533 |
| 23. | 78722 | 4.3% | 4.3%(-0.003)#623 | 5.1%(-0.755)#13,870 |
| 24. | 78738 | 4.3% | 4.3%(-0.040)#633 | 5.1%(-0.793)#14,002 |
| 25. | 78727 | 4.2% | 4.3%(-0.124)#665 | 5.1%(-0.877)#14,316 |
| 26. | 78739 | 4.1% | 4.3%(-0.150)#671 | 5.1%(-0.903)#14,411 |
| 27. | 78701 | 4.1% | 4.3%(-0.238)#692 | 5.1%(-0.991)#14,710 |
| 28. | 78702 | 4.1% | 4.3%(-0.247)#693 | 5.1%(-0.999)#14,741 |
| 29. | 78728 | 4.0% | 4.3%(-0.296)#705 | 5.1%(-1.05)#14,909 |
| 30. | 78753 | 4.0% | 4.3%(-0.316)#716 | 5.1%(-1.07)#14,992 |
| 31. | 78734 | 3.9% | 4.3%(-0.416)#751 | 5.1%(-1.17)#15,337 |
| 32. | 78750 | 3.6% | 4.3%(-0.690)#824 | 5.1%(-1.44)#16,306 |
| 33. | 78735 | 3.6% | 4.3%(-0.748)#838 | 5.1%(-1.50)#16,535 |
| 34. | 78721 | 3.3% | 4.3%(-0.950)#887 | 5.1%(-1.70)#17,157 |
| 35. | 78719 | 3.3% | 4.3%(-0.965)#892 | 5.1%(-1.72)#17,203 |
| 36. | 78754 | 3.3% | 4.3%(-0.993)#896 | 5.1%(-1.75)#17,284 |
| 37. | 78759 | 3.2% | 4.3%(-1.09)#915 | 5.1%(-1.84)#17,610 |
| 38. | 78736 | 3.2% | 4.3%(-1.11)#921 | 5.1%(-1.87)#17,696 |
| 39. | 78717 | 3.0% | 4.3%(-1.34)#983 | 5.1%(-2.10)#18,365 |
| 40. | 78705 | 2.3% | 4.3%(-1.96)#1,091 | 5.1%(-2.71)#20,001 |
| 41. | 78733 | 2.3% | 4.3%(-1.99)#1,103 | 5.1%(-2.75)#20,092 |
| 42. | 78726 | 2.3% | 4.3%(-2.03)#1,111 | 5.1%(-2.79)#20,218 |
1
Common Questions
What are the Top 10 Zip Codes with the Highest Percentage of Population with a Degree in Psychology in Austin, TX?
Top 10 Zip Codes with the Highest Percentage of Population with a Degree in Psychology in Austin, TX are:
What zip code has the Highest Percentage of Population with a Degree in Psychology in Austin, TX?
78725 has the Highest Percentage of Population with a Degree in Psychology in Austin, TX with 15.0%.
What is the Percentage of Population with a Degree in Psychology in Austin, TX?
Percentage of Population with a Degree in Psychology in Austin is 5.0%.
What is the Percentage of Population with a Degree in Psychology in Texas?
Percentage of Population with a Degree in Psychology in Texas is 4.3%.
What is the Percentage of Population with a Degree in Psychology in the United States?
Percentage of Population with a Degree in Psychology in the United States is 5.1%.