Zip Codes with the Highest Percentage of Population Employed in Mining, Quarrying, & Extraction in Austin, TX
RELATED REPORTS & OPTIONS
Mining, Quarrying, & Extraction
Austin
Compare Zip Codes
Map of Zip Codes with the Highest Percentage of Population Employed in Mining, Quarrying, & Extraction in Austin
0.078%
1.6%
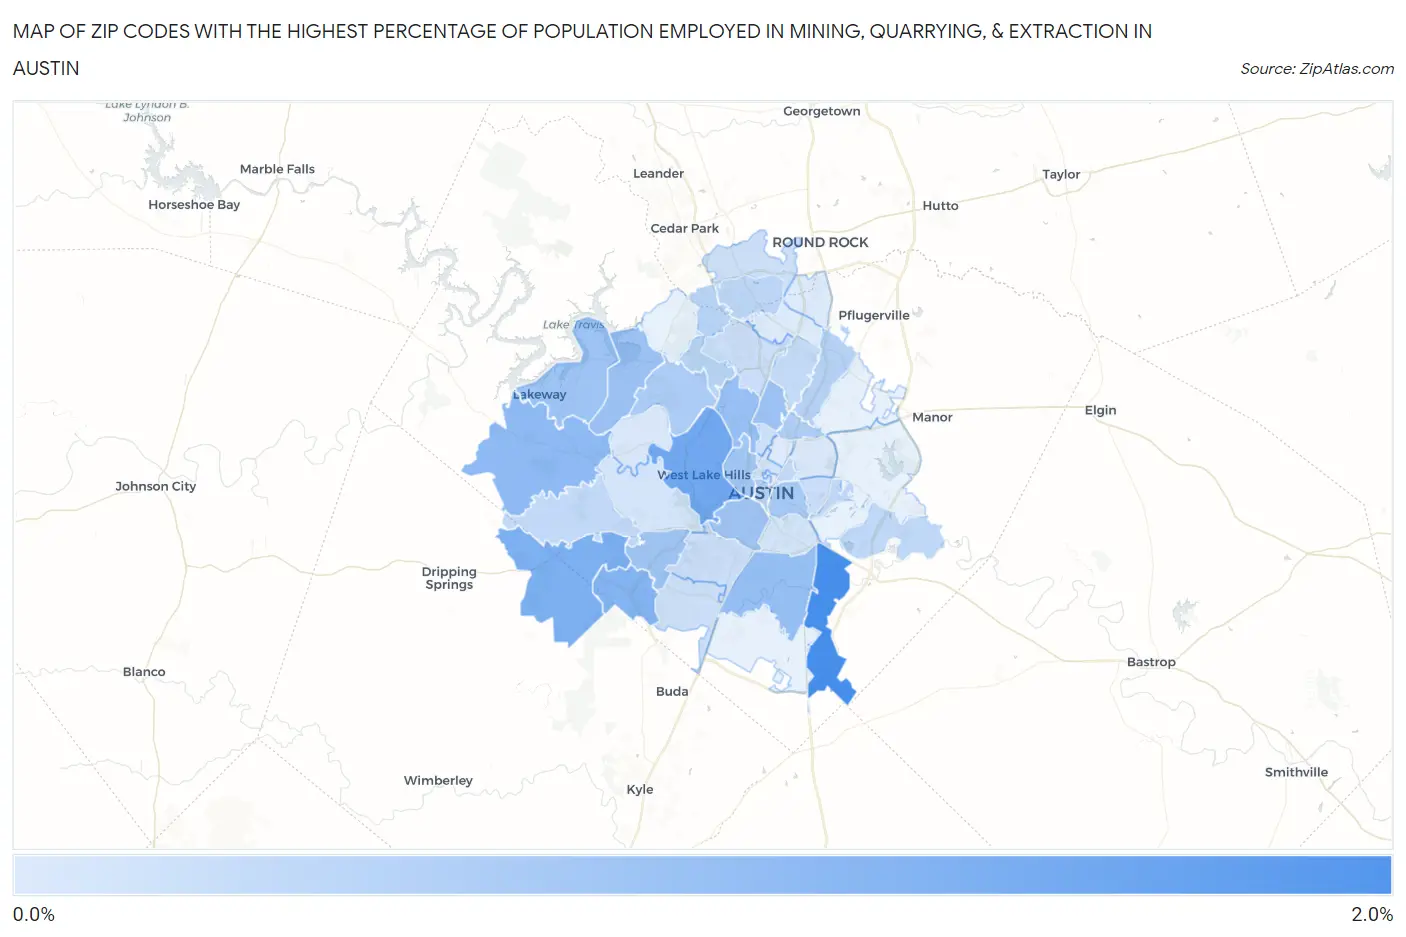
Zip Codes with the Highest Percentage of Population Employed in Mining, Quarrying, & Extraction in Austin, TX
| Zip Code | % Employed | vs State | vs National | |
| 1. | 78719 | 1.6% | 1.9%(-0.288)#763 | 0.44%(+1.13)#4,250 |
| 2. | 78746 | 1.1% | 1.9%(-0.710)#879 | 0.44%(+0.703)#5,032 |
| 3. | 78737 | 1.0% | 1.9%(-0.806)#912 | 0.44%(+0.608)#5,261 |
| 4. | 78739 | 0.95% | 1.9%(-0.908)#958 | 0.44%(+0.506)#5,524 |
| 5. | 78738 | 0.86% | 1.9%(-0.993)#1,004 | 0.44%(+0.421)#5,771 |
| 6. | 78744 | 0.78% | 1.9%(-1.07)#1,043 | 0.44%(+0.340)#6,051 |
| 7. | 78731 | 0.76% | 1.9%(-1.10)#1,059 | 0.44%(+0.317)#6,127 |
| 8. | 78732 | 0.74% | 1.9%(-1.11)#1,065 | 0.44%(+0.303)#6,178 |
| 9. | 78757 | 0.74% | 1.9%(-1.12)#1,071 | 0.44%(+0.296)#6,202 |
| 10. | 78734 | 0.69% | 1.9%(-1.17)#1,097 | 0.44%(+0.248)#6,382 |
| 11. | 78749 | 0.68% | 1.9%(-1.17)#1,104 | 0.44%(+0.239)#6,423 |
| 12. | 78704 | 0.68% | 1.9%(-1.18)#1,105 | 0.44%(+0.236)#6,434 |
| 13. | 78703 | 0.64% | 1.9%(-1.21)#1,134 | 0.44%(+0.199)#6,592 |
| 14. | 78702 | 0.60% | 1.9%(-1.25)#1,151 | 0.44%(+0.163)#6,750 |
| 15. | 78730 | 0.56% | 1.9%(-1.29)#1,173 | 0.44%(+0.122)#6,915 |
| 16. | 78752 | 0.53% | 1.9%(-1.33)#1,194 | 0.44%(+0.086)#7,074 |
| 17. | 78701 | 0.49% | 1.9%(-1.36)#1,218 | 0.44%(+0.051)#7,240 |
| 18. | 78753 | 0.46% | 1.9%(-1.39)#1,233 | 0.44%(+0.022)#7,404 |
| 19. | 78750 | 0.42% | 1.9%(-1.43)#1,256 | 0.44%(-0.017)#7,629 |
| 20. | 78729 | 0.40% | 1.9%(-1.46)#1,273 | 0.44%(-0.044)#7,806 |
| 21. | 78725 | 0.38% | 1.9%(-1.47)#1,288 | 0.44%(-0.059)#7,903 |
| 22. | 78722 | 0.37% | 1.9%(-1.49)#1,292 | 0.44%(-0.074)#8,003 |
| 23. | 78736 | 0.34% | 1.9%(-1.51)#1,312 | 0.44%(-0.097)#8,176 |
| 24. | 78758 | 0.33% | 1.9%(-1.53)#1,322 | 0.44%(-0.114)#8,288 |
| 25. | 78721 | 0.27% | 1.9%(-1.59)#1,363 | 0.44%(-0.172)#8,794 |
| 26. | 78745 | 0.26% | 1.9%(-1.59)#1,368 | 0.44%(-0.178)#8,855 |
| 27. | 78759 | 0.26% | 1.9%(-1.59)#1,372 | 0.44%(-0.181)#8,885 |
| 28. | 78748 | 0.24% | 1.9%(-1.62)#1,384 | 0.44%(-0.203)#9,097 |
| 29. | 78756 | 0.23% | 1.9%(-1.62)#1,386 | 0.44%(-0.206)#9,127 |
| 30. | 78717 | 0.23% | 1.9%(-1.62)#1,387 | 0.44%(-0.206)#9,131 |
| 31. | 78705 | 0.19% | 1.9%(-1.67)#1,416 | 0.44%(-0.254)#9,671 |
| 32. | 78735 | 0.18% | 1.9%(-1.68)#1,422 | 0.44%(-0.263)#9,762 |
| 33. | 78741 | 0.16% | 1.9%(-1.69)#1,429 | 0.44%(-0.278)#9,933 |
| 34. | 78733 | 0.12% | 1.9%(-1.73)#1,443 | 0.44%(-0.320)#10,495 |
| 35. | 78723 | 0.12% | 1.9%(-1.73)#1,445 | 0.44%(-0.321)#10,510 |
| 36. | 78727 | 0.089% | 1.9%(-1.76)#1,457 | 0.44%(-0.351)#10,975 |
| 37. | 78751 | 0.079% | 1.9%(-1.77)#1,460 | 0.44%(-0.361)#11,163 |
| 38. | 78728 | 0.078% | 1.9%(-1.78)#1,461 | 0.44%(-0.362)#11,184 |
1
Common Questions
What are the Top 10 Zip Codes with the Highest Percentage of Population Employed in Mining, Quarrying, & Extraction in Austin, TX?
Top 10 Zip Codes with the Highest Percentage of Population Employed in Mining, Quarrying, & Extraction in Austin, TX are:
What zip code has the Highest Percentage of Population Employed in Mining, Quarrying, & Extraction in Austin, TX?
78719 has the Highest Percentage of Population Employed in Mining, Quarrying, & Extraction in Austin, TX with 1.6%.
What is the Percentage of Population Employed in Mining, Quarrying, & Extraction in Austin, TX?
Percentage of Population Employed in Mining, Quarrying, & Extraction in Austin is 0.39%.
What is the Percentage of Population Employed in Mining, Quarrying, & Extraction in Texas?
Percentage of Population Employed in Mining, Quarrying, & Extraction in Texas is 1.9%.
What is the Percentage of Population Employed in Mining, Quarrying, & Extraction in the United States?
Percentage of Population Employed in Mining, Quarrying, & Extraction in the United States is 0.44%.