Zip Codes with the Lowest Percentage of Single Mothers in Austin, TX

RELATED REPORTS & OPTIONS

Fewest Single Mothers
Population
Families and Households
Female Fertility
Female Fertility (Unmarried)
Race (Community Size)
Race (Percentage)
Ancestry (Community Size)
AfghanAfricanAlbanianAlsatianAmericanApacheArabArgentineanArmenianAssyrian / Chaldean / SyriacAustralianAustrianBahamianBangladeshiBarbadianBasqueBelgianBelizeanBhutaneseBlackfeetBolivianBrazilianBritishBritish West IndianBulgarianBurmeseCajunCambodianCanadianCape VerdeanCelticCentral AmericanCentral American IndianCherokeeCheyenneChickasawChileanChippewaChoctawColombianComancheCosta RicanCreeCreekCroatianCrowCubanCzechCzechoslovakianDanishDelawareDominicanDutchDutch West IndianEastern EuropeanEcuadorianEgyptianEnglishEstonianEthiopianEuropeanFilipinoFinnishFrenchFrench American IndianFrench CanadianGermanGerman RussianGhanaianGreekGuamanian / ChamorroGuatemalanGuyaneseHaitianHonduranHopiHungarianIcelanderIndian (Asian)IndonesianIranianIraqiIrishIroquoisIsraeliItalianJamaicanJapaneseJordanianKenyanKiowaKoreanLaotianLatvianLebaneseLiberianLithuanianLumbeeLuxembourgerMacedonianMalaysianMalteseMexicanMexican American IndianMongolianMoroccanNative HawaiianNavajoNew ZealanderNicaraguanNigerianNorthern EuropeanNorwegianOkinawanOsagePakistaniPalestinianPanamanianParaguayanPennsylvania GermanPeruvianPolishPortuguesePotawatomiPuebloPuerto RicanRomanianRussianSalvadoranSamoanScandinavianScotch-IrishScottishSeminoleSerbianSiouxSlavicSlovakSloveneSomaliSouth AfricanSouth AmericanSouth American IndianSpaniardSpanishSpanish AmericanSpanish American IndianSri LankanSubsaharan AfricanSudaneseSwedishSwissSyrianThaiTlingit-HaidaTonganTrinidadian and TobagonianTurkishUkrainianUruguayanVenezuelanVietnameseWelshWest IndianYaquiYugoslavian
Ancestry (Percentage)
AfghanAfricanAlbanianAlsatianAmericanApacheArabArgentineanArmenianAssyrian / Chaldean / SyriacAustralianAustrianBahamianBangladeshiBarbadianBasqueBelgianBelizeanBhutaneseBlackfeetBolivianBrazilianBritishBritish West IndianBulgarianBurmeseCajunCambodianCanadianCape VerdeanCelticCentral AmericanCentral American IndianCherokeeCheyenneChickasawChileanChippewaChoctawColombianComancheCosta RicanCreeCreekCroatianCrowCubanCzechCzechoslovakianDanishDelawareDominicanDutchDutch West IndianEastern EuropeanEcuadorianEgyptianEnglishEstonianEthiopianEuropeanFilipinoFinnishFrenchFrench American IndianFrench CanadianGermanGerman RussianGhanaianGreekGuamanian / ChamorroGuatemalanGuyaneseHaitianHonduranHopiHungarianIcelanderIndian (Asian)IndonesianIranianIraqiIrishIroquoisIsraeliItalianJamaicanJapaneseJordanianKenyanKiowaKoreanLaotianLatvianLebaneseLiberianLithuanianLumbeeLuxembourgerMacedonianMalaysianMalteseMexicanMexican American IndianMongolianMoroccanNative HawaiianNavajoNew ZealanderNicaraguanNigerianNorthern EuropeanNorwegianOkinawanOsagePakistaniPalestinianPanamanianParaguayanPennsylvania GermanPeruvianPolishPortuguesePotawatomiPuebloPuerto RicanRomanianRussianSalvadoranSamoanScandinavianScotch-IrishScottishSeminoleSerbianSiouxSlavicSlovakSloveneSomaliSouth AfricanSouth AmericanSouth American IndianSpaniardSpanishSpanish AmericanSpanish American IndianSri LankanSubsaharan AfricanSudaneseSwedishSwissSyrianThaiTlingit-HaidaTonganTrinidadian and TobagonianTurkishUkrainianUruguayanVenezuelanVietnameseWelshWest IndianYaquiYugoslavian
Immigrant Origin (Total)
AfghanistanAfricaAlbaniaArgentinaAsiaAustraliaAustriaBahamasBangladeshBarbadosBelarusBelgiumBelizeBoliviaBosnia and HerzegovinaBrazilBulgariaBurma / MyanmarCambodiaCameroonCanadaCaribbeanCentral AmericaChileChinaColombiaCongoCosta RicaCroatiaCubaCzechoslovakiaDenmarkDominicaDominican RepublicEastern AfricaEastern AsiaEastern EuropeEcuadorEgyptEl SalvadorEnglandEritreaEthiopiaEuropeFranceGermanyGhanaGreeceGuatemalaGuyanaHaitiHondurasHong KongHungaryIndiaIndonesiaIranIraqIrelandIsraelItalyJamaicaJapanJordanKazakhstanKenyaKoreaKuwaitLaosLatin AmericaLatviaLebanonLiberiaLithuaniaMalaysiaMexicoMiddle AfricaMoldovaMoroccoNepalNetherlandsNicaraguaNigeriaNorthern AfricaNorthern EuropeNorwayOceaniaPakistanPanamaPeruPhilippinesPolandPortugalRomaniaRussiaSaudi ArabiaScotlandSerbiaSierra LeoneSingaporeSouth AfricaSouth AmericaSouth Central AsiaSouth Eastern AsiaSouthern EuropeSpainSri LankaSudanSwedenSwitzerlandSyriaTaiwanThailandTrinidad and TobagoTurkeyUgandaUkraineUruguayUzbekistanVenezuelaVietnamWestern AfricaWestern AsiaWestern EuropeYemenZaireZimbabwe
Immigrant Origin (Percentage)
AfghanistanAfricaAlbaniaArgentinaAsiaAustraliaAustriaBahamasBangladeshBarbadosBelarusBelgiumBelizeBoliviaBosnia and HerzegovinaBrazilBulgariaBurma / MyanmarCambodiaCameroonCanadaCaribbeanCentral AmericaChileChinaColombiaCongoCosta RicaCroatiaCubaCzechoslovakiaDenmarkDominicaDominican RepublicEastern AfricaEastern AsiaEastern EuropeEcuadorEgyptEl SalvadorEnglandEritreaEthiopiaEuropeFranceGermanyGhanaGreeceGuatemalaGuyanaHaitiHondurasHong KongHungaryIndiaIndonesiaIranIraqIrelandIsraelItalyJamaicaJapanJordanKazakhstanKenyaKoreaKuwaitLaosLatin AmericaLatviaLebanonLiberiaLithuaniaMalaysiaMexicoMiddle AfricaMoldovaMoroccoNepalNetherlandsNicaraguaNigeriaNorthern AfricaNorthern EuropeNorwayOceaniaPakistanPanamaPeruPhilippinesPolandPortugalRomaniaRussiaSaudi ArabiaScotlandSerbiaSierra LeoneSingaporeSouth AfricaSouth AmericaSouth Central AsiaSouth Eastern AsiaSouthern EuropeSpainSri LankaSudanSwedenSwitzerlandSyriaTaiwanThailandTrinidad and TobagoTurkeyUgandaUkraineUruguayUzbekistanVenezuelaVietnamWestern AfricaWestern AsiaWestern EuropeYemenZaireZimbabwe
Income
Income (Families)
Income (Households)
Poverty
Poverty (Families)
Unemployment
Employment Occupations
Employment Industries
Employer Class
Commute Time
Commute Means
School Enrollment
Education by Degree Field
Occupancy
Finances
Physical Characteristics
Austin
Compare Zip Codes
Comparison Subject

Map of Zip Codes with the Lowest Percentage of Single Mothers in Austin

24.39%
0.70%
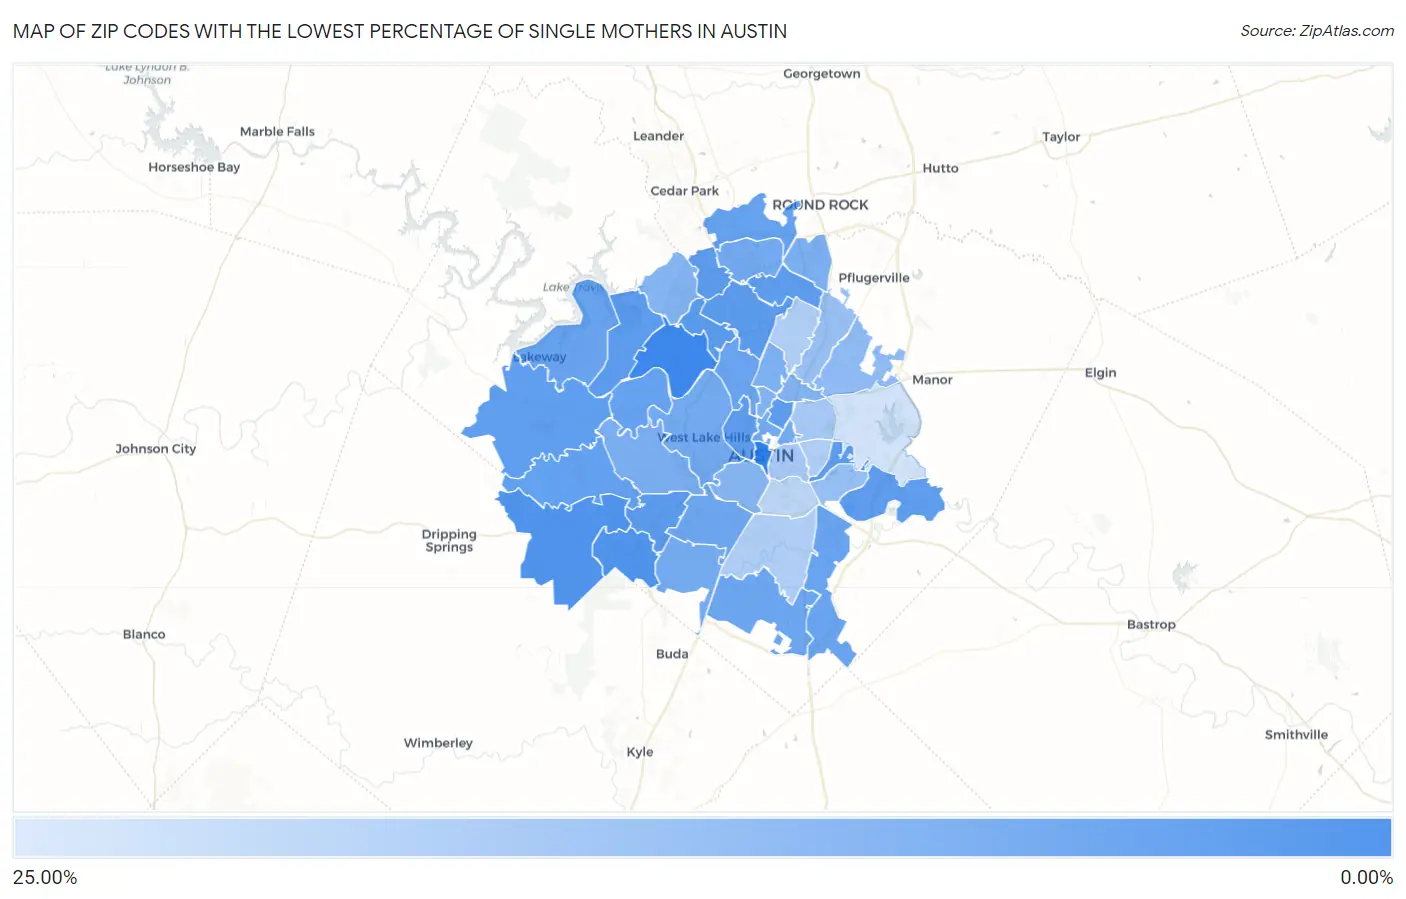
Zip Codes with the Lowest Percentage of Single Mothers in Austin Map

Zip Codes with the Lowest Percentage of Single Mothers in Austin, TX

Zip Code % Single Mothers vs State vs National
1. 78730 0.70% 12.86% (-12.2)#3 11.49% (-10.8)#164
2. 78739 3.82% 12.86% (-9.03)#140 11.49% (-7.66)#3,952
3. 78737 3.85% 12.86% (-9.00)#142 11.49% (-7.64)#4,008
4. 78749 5.32% 12.86% (-7.54)#253 11.49% (-6.17)#6,721
5. 78759 5.35% 12.86% (-7.51)#255 11.49% (-6.14)#6,787
6. 78750 5.44% 12.86% (-7.42)#262 11.49% (-6.05)#6,969
7. 78751 5.52% 12.86% (-7.34)#268 11.49% (-5.97)#7,141
8. 78727 5.59% 12.86% (-7.26)#277 11.49% (-5.90)#7,288
9. 78725 5.63% 12.86% (-7.22)#280 11.49% (-5.85)#7,362
10. 78732 5.71% 12.86% (-7.15)#290 11.49% (-5.78)#7,514
11. 78703 5.88% 12.86% (-6.98)#311 11.49% (-5.61)#7,846
12. 78738 6.02% 12.86% (-6.83)#319 11.49% (-5.47)#8,155
13. 78736 6.59% 12.86% (-6.26)#380 11.49% (-4.90)#9,274
14. 78717 6.83% 12.86% (-6.03)#400 11.49% (-4.66)#9,742
15. 78733 6.90% 12.86% (-5.95)#406 11.49% (-4.58)#9,907
16. 78734 7.20% 12.86% (-5.66)#432 11.49% (-4.29)#10,505
17. 78731 7.30% 12.86% (-5.56)#445 11.49% (-4.19)#10,736
18. 78719 7.33% 12.86% (-5.52)#448 11.49% (-4.15)#10,807
19. 78747 7.73% 12.86% (-5.13)#488 11.49% (-3.76)#11,623
20. 78745 8.07% 12.86% (-4.79)#521 11.49% (-3.42)#12,247
21. 78746 8.73% 12.86% (-4.13)#588 11.49% (-2.76)#13,539
22. 78729 8.82% 12.86% (-4.04)#593 11.49% (-2.67)#13,690
23. 78722 8.94% 12.86% (-3.91)#604 11.49% (-2.54)#13,911
24. 78705 9.36% 12.86% (-3.50)#642 11.49% (-2.13)#14,616
25. 78748 9.37% 12.86% (-3.48)#646 11.49% (-2.11)#14,645
26. 78735 10.03% 12.86% (-2.82)#706 11.49% (-1.45)#15,742
27. 78757 10.17% 12.86% (-2.68)#721 11.49% (-1.31)#15,955
28. 78728 10.44% 12.86% (-2.42)#750 11.49% (-1.05)#16,389
29. 78756 10.88% 12.86% (-1.98)#800 11.49% (-0.607)#17,052
30. 78752 10.98% 12.86% (-1.87)#804 11.49% (-0.505)#17,184
31. 78726 11.36% 12.86% (-1.50)#845 11.49% (-0.132)#17,716
32. 78704 11.94% 12.86% (-0.913)#888 11.49% (+0.456)#18,509
33. 78754 13.29% 12.86% (+0.432)#1,011 11.49% (+1.80)#20,095
34. 78742 14.29% 12.86% (+1.43)#1,081 11.49% (+2.80)#21,134
35. 78753 14.78% 12.86% (+1.92)#1,112 11.49% (+3.29)#21,544
36. 78702 17.06% 12.86% (+4.21)#1,262 11.49% (+5.58)#23,146
37. 78723 17.10% 12.86% (+4.24)#1,268 11.49% (+5.61)#23,173
38. 78721 18.47% 12.86% (+5.62)#1,329 11.49% (+6.98)#23,906
39. 78758 18.59% 12.86% (+5.73)#1,336 11.49% (+7.10)#23,961
40. 78744 18.62% 12.86% (+5.77)#1,343 11.49% (+7.14)#23,992
41. 78741 21.00% 12.86% (+8.14)#1,422 11.49% (+9.51)#24,960
42. 78724 24.39% 12.86% (+11.5)#1,514 11.49% (+12.9)#25,880

Common Questions

What are the Top 10 Zip Codes with the Lowest Percentage of Single Mothers in Austin, TX?
Top 10 Zip Codes with the Lowest Percentage of Single Mothers in Austin, TX are:
#1
0.00%
#2
0.70%
#3
3.82%
#4
3.85%
#5
5.32%
#6
5.35%
#7
5.44%
#8
5.52%
#9
5.59%
#10
5.63%
What zip code has the Lowest Percentage of Single Mothers in Austin, TX?
78730 has the Lowest Percentage of Single Mothers in Austin, TX with 0.70%.
What is the Percentage of Single Mothers in Austin, TX?
Percentage of Single Mothers in Austin is 11.22%.
What is the Percentage of Single Mothers in Texas?
Percentage of Single Mothers in Texas is 12.86%.
What is the Percentage of Single Mothers in the United States?
Percentage of Single Mothers in the United States is 11.49%.