Zip Codes with the Highest Percentage of Population with a Degree in Visual and Performing Arts in Lenoir City, TN
RELATED REPORTS & OPTIONS
Visual and Performing Arts
Lenoir City
Compare Zip Codes
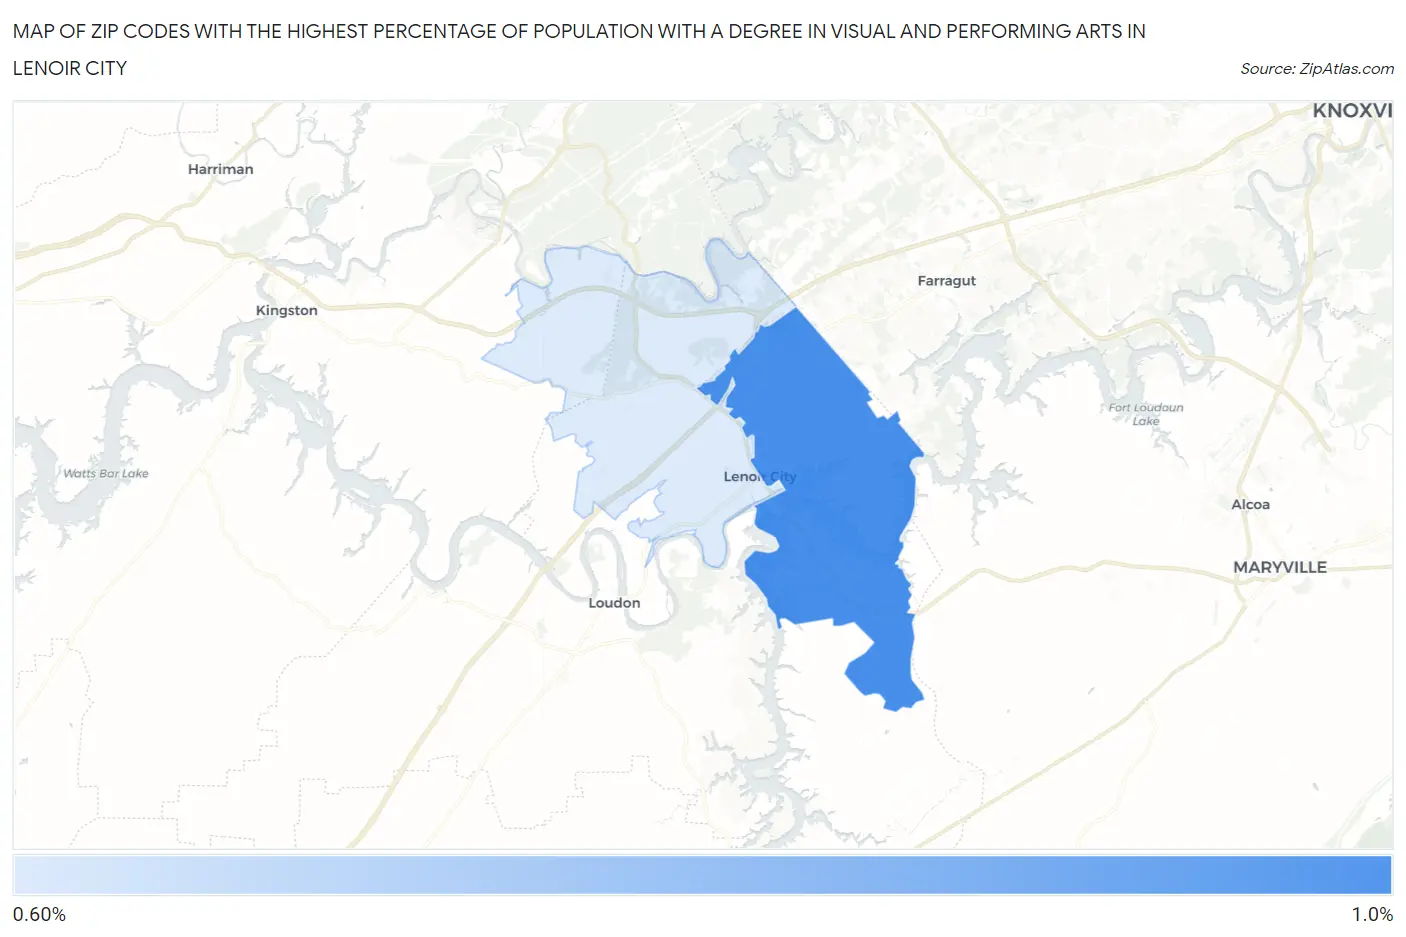
Map of Zip Codes with the Highest Percentage of Population with a Degree in Visual and Performing Arts in Lenoir City
0.63%
0.82%
Zip Codes with the Highest Percentage of Population with a Degree in Visual and Performing Arts in Lenoir City, TN
| Zip Code | % Graduates | vs State | vs National | |
| 1. | 37772 | 0.82% | 4.1%(-3.25)#374 | 4.3%(-3.43)#20,101 |
| 2. | 37771 | 0.63% | 4.1%(-3.43)#386 | 4.3%(-3.62)#20,503 |
1
Common Questions
What are the Top Zip Codes with the Highest Percentage of Population with a Degree in Visual and Performing Arts in Lenoir City, TN?
Top Zip Codes with the Highest Percentage of Population with a Degree in Visual and Performing Arts in Lenoir City, TN are:
What zip code has the Highest Percentage of Population with a Degree in Visual and Performing Arts in Lenoir City, TN?
37772 has the Highest Percentage of Population with a Degree in Visual and Performing Arts in Lenoir City, TN with 0.82%.
What is the Percentage of Population with a Degree in Visual and Performing Arts in Tennessee?
Percentage of Population with a Degree in Visual and Performing Arts in Tennessee is 4.1%.
What is the Percentage of Population with a Degree in Visual and Performing Arts in the United States?
Percentage of Population with a Degree in Visual and Performing Arts in the United States is 4.3%.