Zip Codes with the Highest Percentage of Population Employed in Arts, Entertainment & Recreation in Lebanon, TN
RELATED REPORTS & OPTIONS
Arts, Entertainment & Recreation
Lebanon
Compare Zip Codes
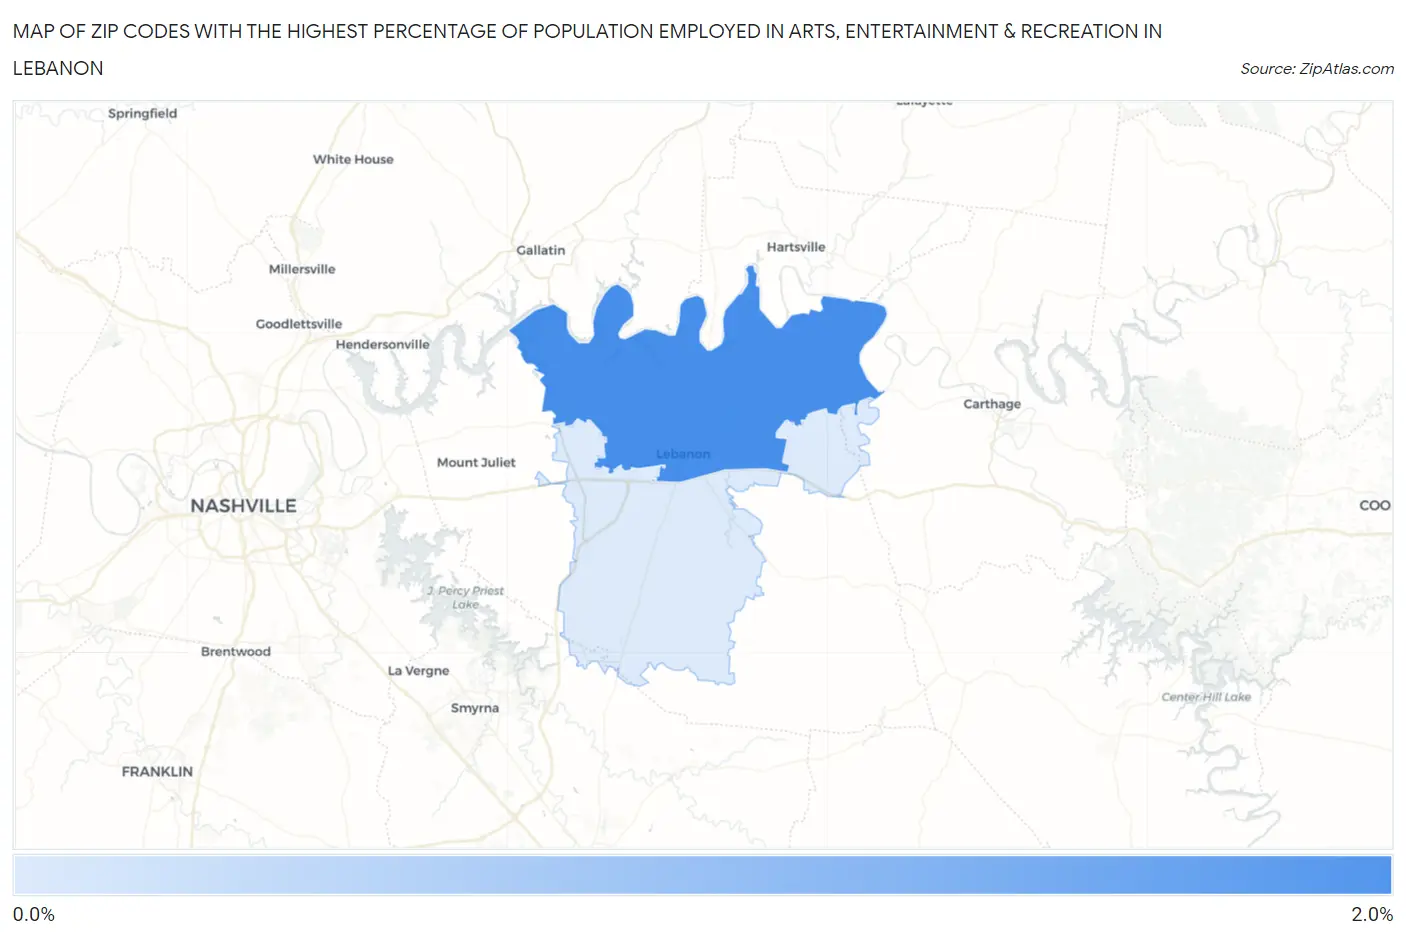
Map of Zip Codes with the Highest Percentage of Population Employed in Arts, Entertainment & Recreation in Lebanon
0.91%
1.5%
Zip Codes with the Highest Percentage of Population Employed in Arts, Entertainment & Recreation in Lebanon, TN
| Zip Code | % Employed | vs State | vs National | |
| 1. | 37087 | 1.5% | 1.8%(-0.276)#196 | 2.1%(-0.572)#13,177 |
| 2. | 37090 | 0.91% | 1.8%(-0.879)#302 | 2.1%(-1.17)#17,622 |
1
Common Questions
What are the Top Zip Codes with the Highest Percentage of Population Employed in Arts, Entertainment & Recreation in Lebanon, TN?
Top Zip Codes with the Highest Percentage of Population Employed in Arts, Entertainment & Recreation in Lebanon, TN are:
What zip code has the Highest Percentage of Population Employed in Arts, Entertainment & Recreation in Lebanon, TN?
37087 has the Highest Percentage of Population Employed in Arts, Entertainment & Recreation in Lebanon, TN with 1.5%.
What is the Percentage of Population Employed in Arts, Entertainment & Recreation in Lebanon, TN?
Percentage of Population Employed in Arts, Entertainment & Recreation in Lebanon is 1.8%.
What is the Percentage of Population Employed in Arts, Entertainment & Recreation in Tennessee?
Percentage of Population Employed in Arts, Entertainment & Recreation in Tennessee is 1.8%.
What is the Percentage of Population Employed in Arts, Entertainment & Recreation in the United States?
Percentage of Population Employed in Arts, Entertainment & Recreation in the United States is 2.1%.