Zip Codes with the Highest Percentage of Population Employed in Legal Services & Support in Lebanon, TN
RELATED REPORTS & OPTIONS
Legal Services & Support
Lebanon
Compare Zip Codes
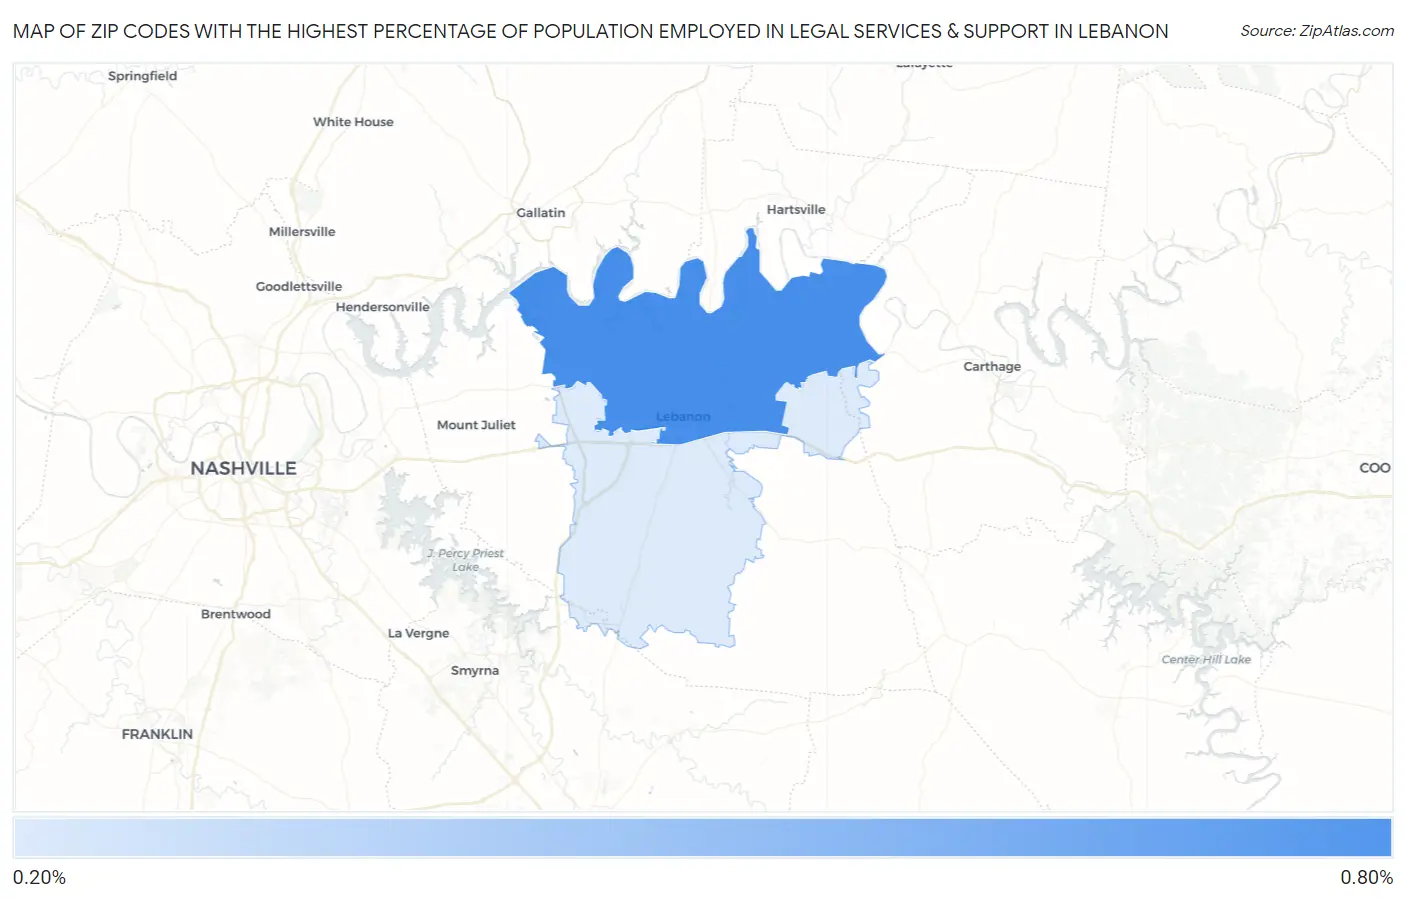
Map of Zip Codes with the Highest Percentage of Population Employed in Legal Services & Support in Lebanon
0.24%
0.64%
Zip Codes with the Highest Percentage of Population Employed in Legal Services & Support in Lebanon, TN
| Zip Code | % Employed | vs State | vs National | |
| 1. | 37087 | 0.64% | 0.90%(-0.262)#186 | 1.2%(-0.548)#11,061 |
| 2. | 37090 | 0.24% | 0.90%(-0.656)#285 | 1.2%(-0.942)#15,730 |
1
Common Questions
What are the Top Zip Codes with the Highest Percentage of Population Employed in Legal Services & Support in Lebanon, TN?
Top Zip Codes with the Highest Percentage of Population Employed in Legal Services & Support in Lebanon, TN are:
What zip code has the Highest Percentage of Population Employed in Legal Services & Support in Lebanon, TN?
37087 has the Highest Percentage of Population Employed in Legal Services & Support in Lebanon, TN with 0.64%.
What is the Percentage of Population Employed in Legal Services & Support in Lebanon, TN?
Percentage of Population Employed in Legal Services & Support in Lebanon is 0.17%.
What is the Percentage of Population Employed in Legal Services & Support in Tennessee?
Percentage of Population Employed in Legal Services & Support in Tennessee is 0.90%.
What is the Percentage of Population Employed in Legal Services & Support in the United States?
Percentage of Population Employed in Legal Services & Support in the United States is 1.2%.