Zip Codes with the Highest Percentage of Population Employed in Food Preparation & Serving in Cranston, RI
RELATED REPORTS & OPTIONS
Food Preparation & Serving
Cranston
Compare Zip Codes
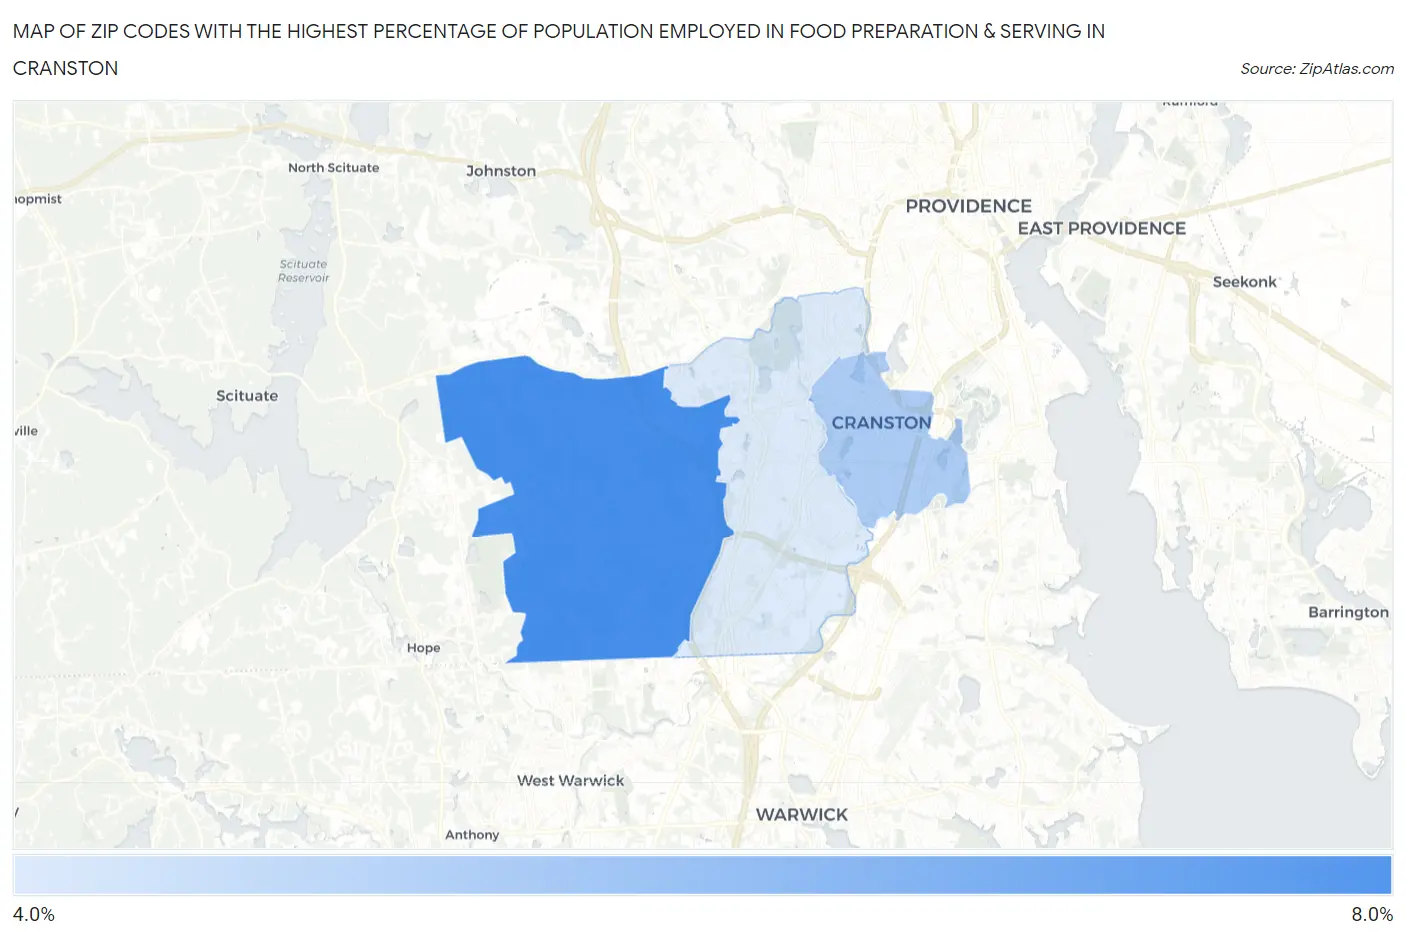
Map of Zip Codes with the Highest Percentage of Population Employed in Food Preparation & Serving in Cranston
4.7%
6.3%
Zip Codes with the Highest Percentage of Population Employed in Food Preparation & Serving in Cranston, RI
| Zip Code | % Employed | vs State | vs National | |
| 1. | 02921 | 6.3% | 5.6%(+0.710)#23 | 5.3%(+0.982)#8,515 |
| 2. | 02910 | 5.2% | 5.6%(-0.370)#42 | 5.3%(-0.097)#12,194 |
| 3. | 02920 | 4.7% | 5.6%(-0.872)#49 | 5.3%(-0.599)#14,212 |
1
Common Questions
What are the Top Zip Codes with the Highest Percentage of Population Employed in Food Preparation & Serving in Cranston, RI?
Top Zip Codes with the Highest Percentage of Population Employed in Food Preparation & Serving in Cranston, RI are:
What zip code has the Highest Percentage of Population Employed in Food Preparation & Serving in Cranston, RI?
02921 has the Highest Percentage of Population Employed in Food Preparation & Serving in Cranston, RI with 6.3%.
What is the Percentage of Population Employed in Food Preparation & Serving in Cranston, RI?
Percentage of Population Employed in Food Preparation & Serving in Cranston is 5.2%.
What is the Percentage of Population Employed in Food Preparation & Serving in Rhode Island?
Percentage of Population Employed in Food Preparation & Serving in Rhode Island is 5.6%.
What is the Percentage of Population Employed in Food Preparation & Serving in the United States?
Percentage of Population Employed in Food Preparation & Serving in the United States is 5.3%.