Zip Codes with the Highest Percentage of Population Employed in Food Preparation & Serving in Providence, RI
RELATED REPORTS & OPTIONS
Food Preparation & Serving
Providence
Compare Zip Codes
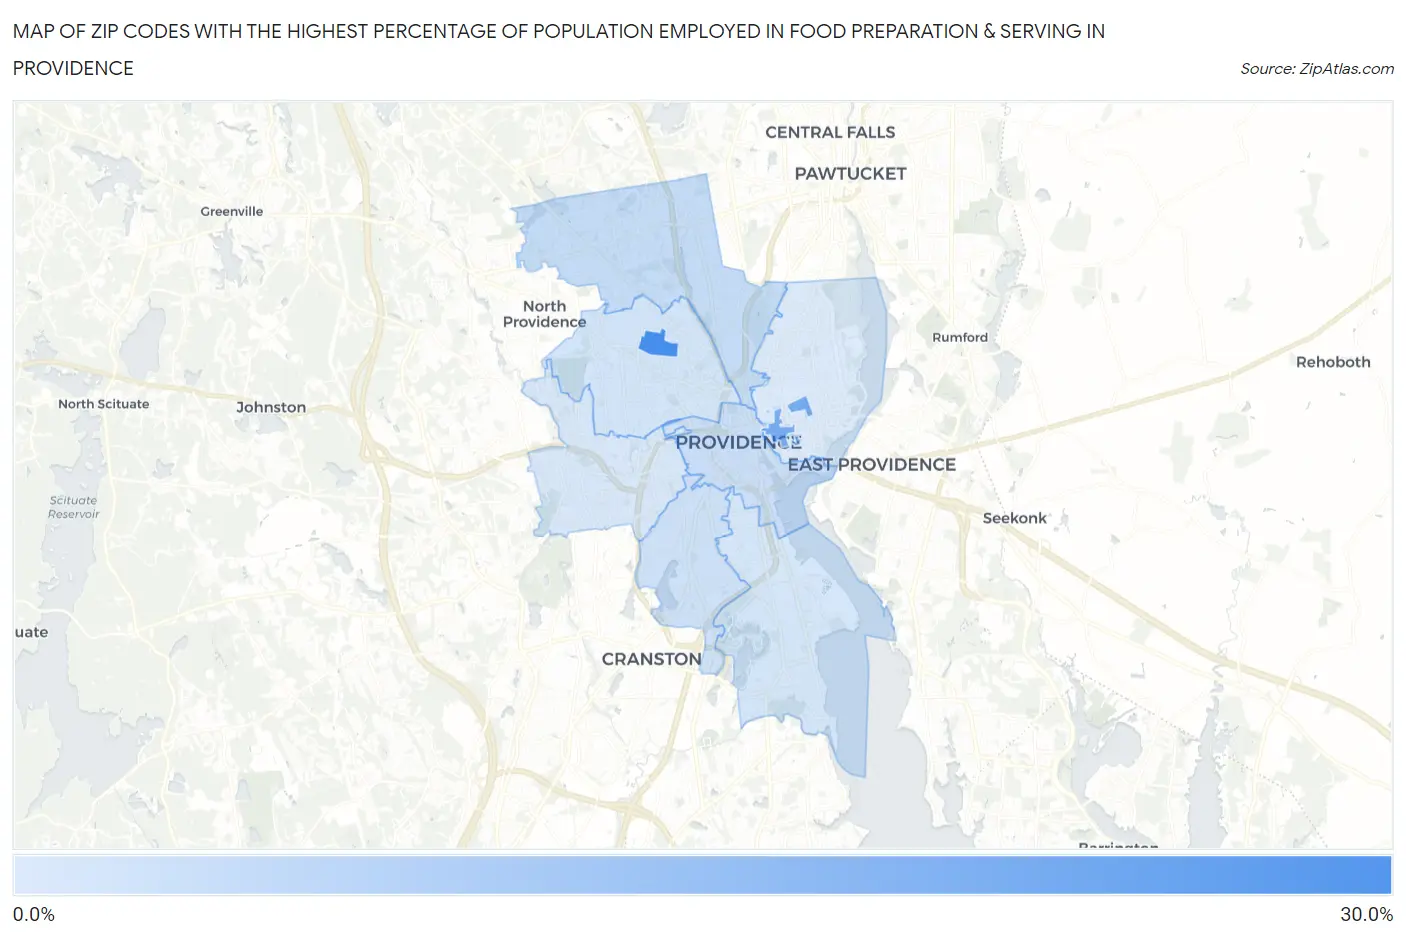
Map of Zip Codes with the Highest Percentage of Population Employed in Food Preparation & Serving in Providence
4.9%
25.6%
Zip Codes with the Highest Percentage of Population Employed in Food Preparation & Serving in Providence, RI
| Zip Code | % Employed | vs State | vs National | |
| 1. | 02918 | 25.6% | 5.6%(+20.0)#2 | 5.3%(+20.3)#299 |
| 2. | 02912 | 18.5% | 5.6%(+12.9)#4 | 5.3%(+13.2)#612 |
| 3. | 02904 | 7.9% | 5.6%(+2.31)#10 | 5.3%(+2.59)#4,931 |
| 4. | 02903 | 7.3% | 5.6%(+1.70)#16 | 5.3%(+1.97)#6,018 |
| 5. | 02907 | 6.7% | 5.6%(+1.16)#19 | 5.3%(+1.43)#7,285 |
| 6. | 02908 | 5.9% | 5.6%(+0.383)#26 | 5.3%(+0.656)#9,532 |
| 7. | 02905 | 5.8% | 5.6%(+0.209)#30 | 5.3%(+0.482)#10,130 |
| 8. | 02909 | 5.5% | 5.6%(-0.099)#37 | 5.3%(+0.174)#11,185 |
| 9. | 02906 | 4.9% | 5.6%(-0.681)#45 | 5.3%(-0.409)#13,462 |
1
Common Questions
What are the Top 5 Zip Codes with the Highest Percentage of Population Employed in Food Preparation & Serving in Providence, RI?
Top 5 Zip Codes with the Highest Percentage of Population Employed in Food Preparation & Serving in Providence, RI are:
What zip code has the Highest Percentage of Population Employed in Food Preparation & Serving in Providence, RI?
02918 has the Highest Percentage of Population Employed in Food Preparation & Serving in Providence, RI with 25.6%.
What is the Percentage of Population Employed in Food Preparation & Serving in Providence, RI?
Percentage of Population Employed in Food Preparation & Serving in Providence is 6.4%.
What is the Percentage of Population Employed in Food Preparation & Serving in Rhode Island?
Percentage of Population Employed in Food Preparation & Serving in Rhode Island is 5.6%.
What is the Percentage of Population Employed in Food Preparation & Serving in the United States?
Percentage of Population Employed in Food Preparation & Serving in the United States is 5.3%.