Zip Codes with the Most Births per 1,000 Teenage Women Under the Age of 20 in Puerto Rico
RELATED REPORTS & OPTIONS
Highest Birth Rate | Women 15-19
Puerto Rico
Compare Zip Codes
Map of Zip Codes with the Most Births per 1,000 Teenage Women Under the Age of 20 in Puerto Rico
0.0
150.0
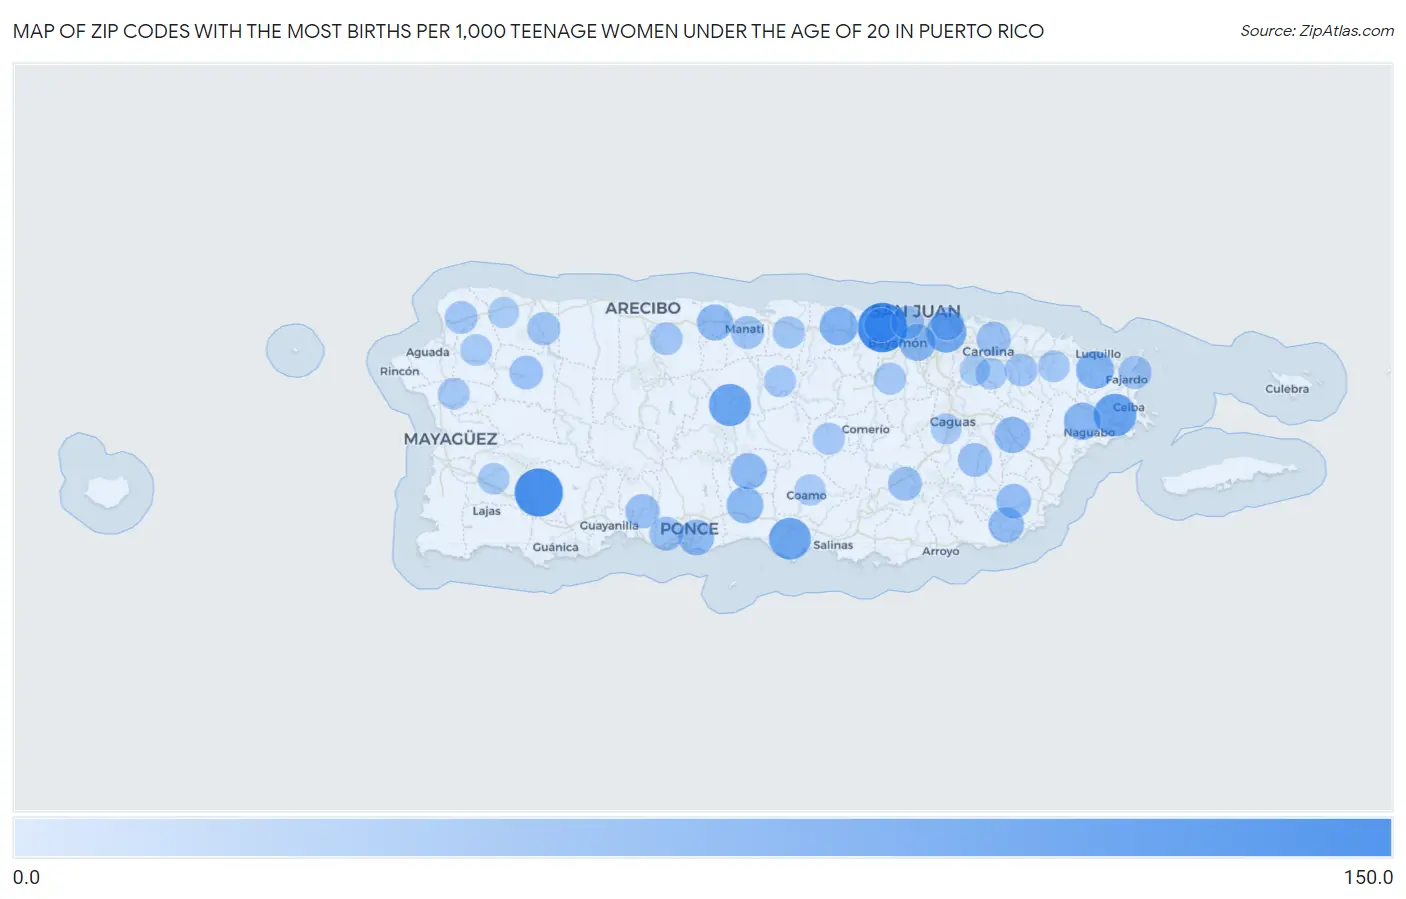
Zip Codes with the Most Births per 1,000 Teenage Women Under the Age of 20 in Puerto Rico
| Zip Code | Births / 1,000 Women | vs State | vs National | |
| 1. | 00952 | 146.0 | 13.0(+133)#1 | 10.0(+136)#480 |
| 2. | 00637 | 136.0 | 13.0(+123)#2 | 10.0(+126)#523 |
| 3. | 00735 | 93.0 | 13.0(+80.0)#3 | 10.0(+83.0)#808 |
| 4. | 00638 | 89.0 | 13.0(+76.0)#4 | 10.0(+79.0)#862 |
| 5. | 00757 | 87.0 | 13.0(+74.0)#5 | 10.0(+77.0)#875 |
| 6. | 00917 | 74.0 | 13.0(+61.0)#6 | 10.0(+64.0)#1,050 |
| 7. | 00646 | 59.0 | 13.0(+46.0)#7 | 10.0(+49.0)#1,294 |
| 8. | 00773 | 57.0 | 13.0(+44.0)#8 | 10.0(+47.0)#1,340 |
| 9. | 00718 | 52.0 | 13.0(+39.0)#9 | 10.0(+42.0)#1,450 |
| 10. | 00966 | 49.0 | 13.0(+36.0)#10 | 10.0(+39.0)#1,531 |
| 11. | 00795 | 48.0 | 13.0(+35.0)#11 | 10.0(+38.0)#1,547 |
| 12. | 00777 | 44.0 | 13.0(+31.0)#12 | 10.0(+34.0)#1,654 |
| 13. | 00617 | 44.0 | 13.0(+31.0)#13 | 10.0(+34.0)#1,662 |
| 14. | 00766 | 44.0 | 13.0(+31.0)#14 | 10.0(+34.0)#1,663 |
| 15. | 00716 | 41.0 | 13.0(+28.0)#15 | 10.0(+31.0)#1,759 |
| 16. | 00707 | 38.0 | 13.0(+25.0)#16 | 10.0(+28.0)#1,852 |
| 17. | 00767 | 33.0 | 13.0(+20.0)#17 | 10.0(+23.0)#2,024 |
| 18. | 00949 | 30.0 | 13.0(+17.0)#18 | 10.0(+20.0)#2,151 |
| 19. | 00624 | 30.0 | 13.0(+17.0)#19 | 10.0(+20.0)#2,177 |
| 20. | 00985 | 28.0 | 13.0(+15.0)#20 | 10.0(+18.0)#2,246 |
| 21. | 00736 | 27.0 | 13.0(+14.0)#21 | 10.0(+17.0)#2,287 |
| 22. | 00728 | 26.0 | 13.0(+13.0)#22 | 10.0(+16.0)#2,336 |
| 23. | 00754 | 26.0 | 13.0(+13.0)#23 | 10.0(+16.0)#2,338 |
| 24. | 00685 | 25.0 | 13.0(+12.0)#24 | 10.0(+15.0)#2,384 |
| 25. | 00678 | 22.0 | 13.0(+9.00)#25 | 10.0(+12.0)#2,582 |
| 26. | 00674 | 21.0 | 13.0(+8.00)#26 | 10.0(+11.0)#2,626 |
| 27. | 00738 | 21.0 | 13.0(+8.00)#27 | 10.0(+11.0)#2,637 |
| 28. | 00915 | 21.0 | 13.0(+8.00)#28 | 10.0(+11.0)#2,649 |
| 29. | 00962 | 20.0 | 13.0(+7.00)#29 | 10.0(+10.00)#2,714 |
| 30. | 00603 | 19.0 | 13.0(+6.00)#30 | 10.0(+9.00)#2,740 |
| 31. | 00612 | 18.0 | 13.0(+5.00)#31 | 10.0(+8.00)#2,808 |
| 32. | 00729 | 18.0 | 13.0(+5.00)#32 | 10.0(+8.00)#2,814 |
| 33. | 00693 | 14.0 | 13.0(+1.000)#33 | 10.0(+4.00)#3,064 |
| 34. | 00956 | 13.0 | 13.0(=0.000)#34 | 10.0(+3.00)#3,126 |
| 35. | 00794 | 13.0 | 13.0(=0.000)#35 | 10.0(+3.00)#3,163 |
| 36. | 00687 | 12.0 | 13.0(-1.000)#36 | 10.0(+2.00)#3,245 |
| 37. | 00745 | 11.0 | 13.0(-2.00)#37 | 10.0(+1.000)#3,284 |
| 38. | 00610 | 11.0 | 13.0(-2.00)#38 | 10.0(+1.000)#3,312 |
| 39. | 00987 | 10.0 | 13.0(-3.00)#39 | 10.0(=0.000)#3,347 |
| 40. | 00676 | 10.0 | 13.0(-3.00)#40 | 10.0(=0.000)#3,365 |
| 41. | 00683 | 9.0 | 13.0(-4.00)#41 | 10.0(-1.000)#3,458 |
| 42. | 00769 | 6.0 | 13.0(-7.00)#42 | 10.0(-4.00)#3,663 |
| 43. | 00976 | 5.0 | 13.0(-8.00)#43 | 10.0(-5.00)#3,712 |
| 44. | 00725 | 4.0 | 13.0(-9.00)#44 | 10.0(-6.00)#3,778 |
| 45. | 00662 | 4.0 | 13.0(-9.00)#45 | 10.0(-6.00)#3,808 |
1
2Common Questions
What are the Top 10 Zip Codes with the Most Births per 1,000 Teenage Women Under the Age of 20 in Puerto Rico?
Top 10 Zip Codes with the Most Births per 1,000 Teenage Women Under the Age of 20 in Puerto Rico are:
What zip code has the Most Births per 1,000 Teenage Women Under the Age of 20 in Puerto Rico?
00952 has the Most Births per 1,000 Teenage Women Under the Age of 20 in Puerto Rico with 146.0.
What is the Number of Births per 1,000 Teenage Women Under the Age of 20 in the State of Puerto Rico?
Number of Births per 1,000 Teenage Women Under the Age of 20 in Puerto Rico is 13.0.
What is the Number of Births per 1,000 Teenage Women Under the Age of 20 in the United States?
Number of Births per 1,000 Teenage Women Under the Age of 20 in the United States is 10.0.