Zip Codes with the Highest Percentage of Households with Income Above $200,000 in Puerto Rico
RELATED REPORTS & OPTIONS
Household Income | $200k+
Puerto Rico
Compare Zip Codes
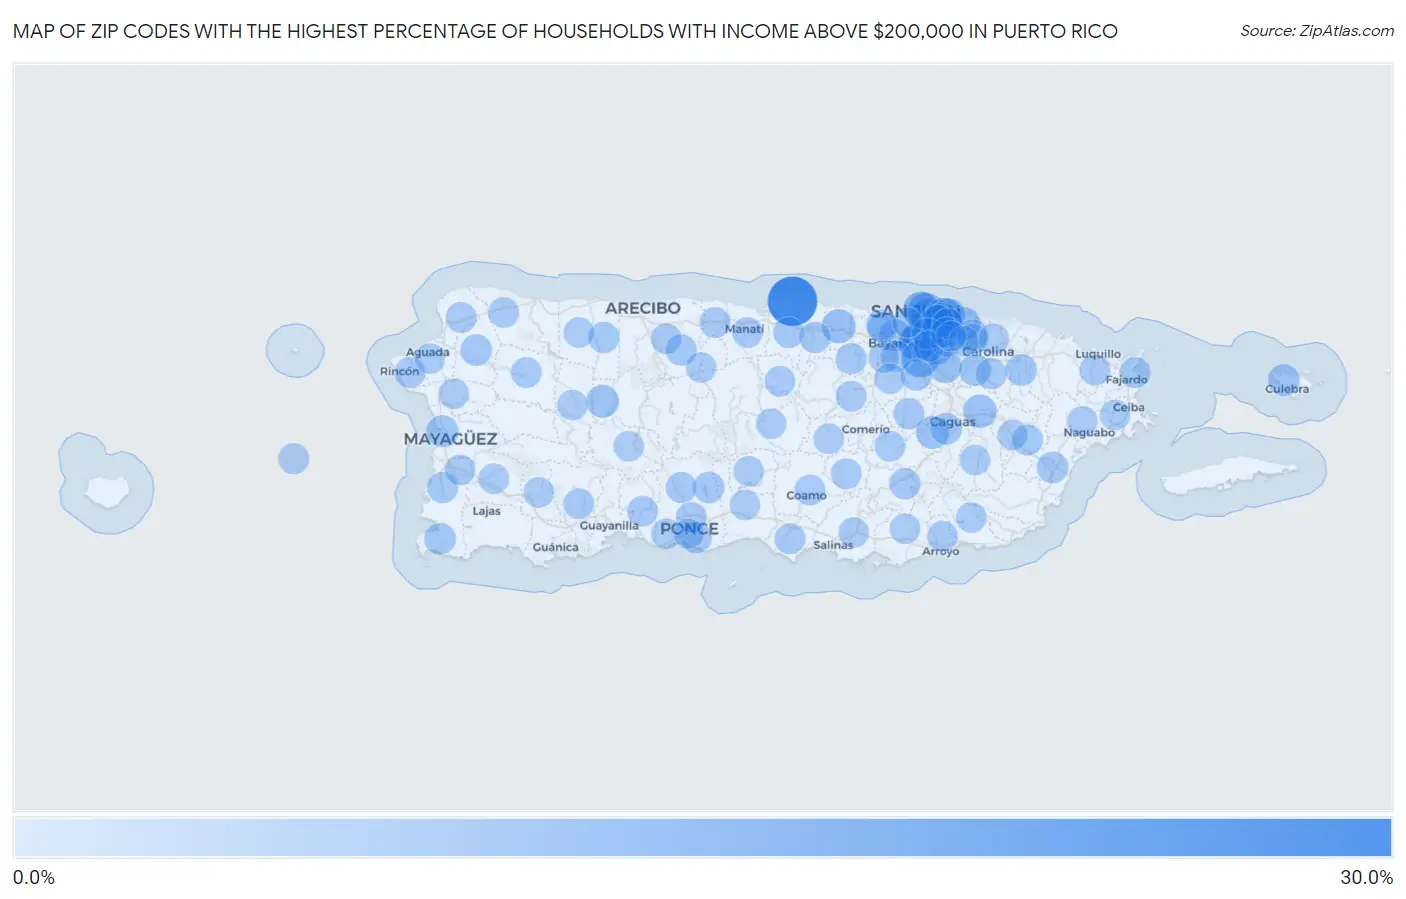
Map of Zip Codes with the Highest Percentage of Households with Income Above $200,000 in Puerto Rico
0.0%
30.0%
Zip Codes with the Highest Percentage of Households with Income Above $200,000 in Puerto Rico
| Zip Code | Households with Income > $200k | vs State | vs National | |
| 1. | 00694 | 26.9% | 1.4%(+25.5)#1 | 11.4%(+15.5)#1,902 |
| 2. | 00968 | 11.5% | 1.4%(+10.1)#2 | 11.4%(+0.100)#7,044 |
| 3. | 00966 | 10.3% | 1.4%(+8.90)#3 | 11.4%(-1.10)#7,971 |
| 4. | 00907 | 9.5% | 1.4%(+8.10)#4 | 11.4%(-1.90)#8,737 |
| 5. | 00969 | 9.4% | 1.4%(+8.00)#5 | 11.4%(-2.00)#8,825 |
| 6. | 00906 | 9.0% | 1.4%(+7.60)#6 | 11.4%(-2.40)#9,302 |
| 7. | 00901 | 8.9% | 1.4%(+7.50)#7 | 11.4%(-2.50)#9,340 |
| 8. | 00911 | 8.6% | 1.4%(+7.20)#8 | 11.4%(-2.80)#9,672 |
| 9. | 00927 | 5.4% | 1.4%(+4.00)#9 | 11.4%(-6.00)#14,703 |
| 10. | 00646 | 5.1% | 1.4%(+3.70)#10 | 11.4%(-6.30)#15,306 |
| 11. | 00918 | 5.0% | 1.4%(+3.60)#11 | 11.4%(-6.40)#15,608 |
| 12. | 00926 | 4.7% | 1.4%(+3.30)#12 | 11.4%(-6.70)#16,248 |
| 13. | 00912 | 4.5% | 1.4%(+3.10)#13 | 11.4%(-6.90)#16,846 |
| 14. | 00979 | 4.4% | 1.4%(+3.00)#14 | 11.4%(-7.00)#17,052 |
| 15. | 00913 | 4.4% | 1.4%(+3.00)#15 | 11.4%(-7.00)#17,090 |
| 16. | 00778 | 4.2% | 1.4%(+2.80)#16 | 11.4%(-7.20)#17,540 |
| 17. | 00727 | 3.6% | 1.4%(+2.20)#17 | 11.4%(-7.80)#19,138 |
| 18. | 00909 | 3.5% | 1.4%(+2.10)#18 | 11.4%(-7.90)#19,544 |
| 19. | 00611 | 3.4% | 1.4%(+2.00)#19 | 11.4%(-8.00)#19,899 |
| 20. | 00682 | 2.3% | 1.4%(+0.900)#20 | 11.4%(-9.10)#22,898 |
| 21. | 00775 | 2.2% | 1.4%(+0.800)#21 | 11.4%(-9.20)#23,366 |
| 22. | 00976 | 2.1% | 1.4%(+0.700)#22 | 11.4%(-9.30)#23,441 |
| 23. | 00961 | 2.1% | 1.4%(+0.700)#23 | 11.4%(-9.30)#23,461 |
| 24. | 00725 | 2.0% | 1.4%(+0.600)#24 | 11.4%(-9.40)#23,731 |
| 25. | 00622 | 2.0% | 1.4%(+0.600)#25 | 11.4%(-9.40)#23,796 |
| 26. | 00729 | 1.8% | 1.4%(+0.400)#26 | 11.4%(-9.60)#24,285 |
| 27. | 00791 | 1.8% | 1.4%(+0.400)#27 | 11.4%(-9.60)#24,286 |
| 28. | 00780 | 1.8% | 1.4%(+0.400)#28 | 11.4%(-9.60)#24,325 |
| 29. | 00716 | 1.7% | 1.4%(+0.300)#29 | 11.4%(-9.70)#24,551 |
| 30. | 00676 | 1.6% | 1.4%(+0.200)#30 | 11.4%(-9.80)#24,800 |
| 31. | 00736 | 1.5% | 1.4%(+0.100)#31 | 11.4%(-9.90)#25,043 |
| 32. | 00971 | 1.5% | 1.4%(+0.100)#32 | 11.4%(-9.90)#25,053 |
| 33. | 00920 | 1.5% | 1.4%(+0.100)#33 | 11.4%(-9.90)#25,062 |
| 34. | 00987 | 1.3% | 1.4%(-0.100)#34 | 11.4%(-10.1)#25,518 |
| 35. | 00692 | 1.3% | 1.4%(-0.100)#35 | 11.4%(-10.1)#25,520 |
| 36. | 00925 | 1.3% | 1.4%(-0.100)#36 | 11.4%(-10.1)#25,573 |
| 37. | 00953 | 1.2% | 1.4%(-0.200)#37 | 11.4%(-10.2)#25,727 |
| 38. | 00959 | 1.2% | 1.4%(-0.200)#38 | 11.4%(-10.2)#25,731 |
| 39. | 00623 | 1.2% | 1.4%(-0.200)#39 | 11.4%(-10.2)#25,736 |
| 40. | 00659 | 1.2% | 1.4%(-0.200)#40 | 11.4%(-10.2)#25,738 |
| 41. | 00983 | 1.2% | 1.4%(-0.200)#41 | 11.4%(-10.2)#25,742 |
| 42. | 00703 | 1.2% | 1.4%(-0.200)#42 | 11.4%(-10.2)#25,748 |
| 43. | 00693 | 1.1% | 1.4%(-0.300)#43 | 11.4%(-10.3)#25,944 |
| 44. | 00921 | 1.1% | 1.4%(-0.300)#44 | 11.4%(-10.3)#25,951 |
| 45. | 00688 | 1.1% | 1.4%(-0.300)#45 | 11.4%(-10.3)#25,977 |
| 46. | 00731 | 1.1% | 1.4%(-0.300)#46 | 11.4%(-10.3)#25,980 |
| 47. | 00771 | 1.0% | 1.4%(-0.400)#47 | 11.4%(-10.4)#26,171 |
| 48. | 00738 | 1.0% | 1.4%(-0.400)#48 | 11.4%(-10.4)#26,173 |
| 49. | 00603 | 0.90% | 1.4%(-0.500)#49 | 11.4%(-10.5)#26,362 |
| 50. | 00680 | 0.90% | 1.4%(-0.500)#50 | 11.4%(-10.5)#26,363 |
| 51. | 00730 | 0.90% | 1.4%(-0.500)#51 | 11.4%(-10.5)#26,367 |
| 52. | 00757 | 0.90% | 1.4%(-0.500)#52 | 11.4%(-10.5)#26,375 |
| 53. | 00773 | 0.90% | 1.4%(-0.500)#53 | 11.4%(-10.5)#26,379 |
| 54. | 00719 | 0.80% | 1.4%(-0.600)#54 | 11.4%(-10.6)#26,540 |
| 55. | 00949 | 0.70% | 1.4%(-0.700)#55 | 11.4%(-10.7)#26,721 |
| 56. | 00612 | 0.70% | 1.4%(-0.700)#56 | 11.4%(-10.7)#26,722 |
| 57. | 00698 | 0.70% | 1.4%(-0.700)#57 | 11.4%(-10.7)#26,725 |
| 58. | 00915 | 0.70% | 1.4%(-0.700)#58 | 11.4%(-10.7)#26,730 |
| 59. | 00705 | 0.70% | 1.4%(-0.700)#59 | 11.4%(-10.7)#26,732 |
| 60. | 00677 | 0.70% | 1.4%(-0.700)#60 | 11.4%(-10.7)#26,739 |
| 61. | 00957 | 0.60% | 1.4%(-0.800)#61 | 11.4%(-10.8)#26,921 |
| 62. | 00685 | 0.60% | 1.4%(-0.800)#62 | 11.4%(-10.8)#26,922 |
| 63. | 00739 | 0.60% | 1.4%(-0.800)#63 | 11.4%(-10.8)#26,924 |
| 64. | 00769 | 0.60% | 1.4%(-0.800)#64 | 11.4%(-10.8)#26,925 |
| 65. | 00624 | 0.60% | 1.4%(-0.800)#65 | 11.4%(-10.8)#26,929 |
| 66. | 00714 | 0.60% | 1.4%(-0.800)#66 | 11.4%(-10.8)#26,933 |
| 67. | 00662 | 0.50% | 1.4%(-0.900)#67 | 11.4%(-10.9)#27,077 |
| 68. | 00674 | 0.50% | 1.4%(-0.900)#68 | 11.4%(-10.9)#27,078 |
| 69. | 00687 | 0.50% | 1.4%(-0.900)#69 | 11.4%(-10.9)#27,080 |
| 70. | 00617 | 0.50% | 1.4%(-0.900)#70 | 11.4%(-10.9)#27,081 |
| 71. | 00917 | 0.50% | 1.4%(-0.900)#71 | 11.4%(-10.9)#27,085 |
| 72. | 00660 | 0.50% | 1.4%(-0.900)#72 | 11.4%(-10.9)#27,090 |
| 73. | 00982 | 0.50% | 1.4%(-0.900)#73 | 11.4%(-10.9)#27,094 |
| 74. | 00952 | 0.50% | 1.4%(-0.900)#74 | 11.4%(-10.9)#27,098 |
| 75. | 00956 | 0.40% | 1.4%(-1.000)#75 | 11.4%(-11.0)#27,227 |
| 76. | 00924 | 0.40% | 1.4%(-1.000)#76 | 11.4%(-11.0)#27,228 |
| 77. | 00728 | 0.40% | 1.4%(-1.000)#77 | 11.4%(-11.0)#27,230 |
| 78. | 00754 | 0.40% | 1.4%(-1.000)#78 | 11.4%(-11.0)#27,231 |
| 79. | 00627 | 0.40% | 1.4%(-1.000)#79 | 11.4%(-11.0)#27,233 |
| 80. | 00985 | 0.40% | 1.4%(-1.000)#80 | 11.4%(-11.0)#27,234 |
| 81. | 00683 | 0.40% | 1.4%(-1.000)#81 | 11.4%(-11.0)#27,235 |
| 82. | 00794 | 0.40% | 1.4%(-1.000)#82 | 11.4%(-11.0)#27,236 |
| 83. | 00610 | 0.40% | 1.4%(-1.000)#83 | 11.4%(-11.0)#27,239 |
| 84. | 00601 | 0.40% | 1.4%(-1.000)#84 | 11.4%(-11.0)#27,244 |
| 85. | 00795 | 0.30% | 1.4%(-1.10)#85 | 11.4%(-11.1)#27,356 |
| 86. | 00602 | 0.30% | 1.4%(-1.10)#86 | 11.4%(-11.1)#27,357 |
| 87. | 00784 | 0.30% | 1.4%(-1.10)#87 | 11.4%(-11.1)#27,358 |
| 88. | 00637 | 0.30% | 1.4%(-1.10)#88 | 11.4%(-11.1)#27,360 |
| 89. | 00766 | 0.30% | 1.4%(-1.10)#89 | 11.4%(-11.1)#27,361 |
| 90. | 00717 | 0.30% | 1.4%(-1.10)#90 | 11.4%(-11.1)#27,369 |
| 91. | 00777 | 0.20% | 1.4%(-1.20)#91 | 11.4%(-11.2)#27,467 |
| 92. | 00669 | 0.20% | 1.4%(-1.20)#92 | 11.4%(-11.2)#27,468 |
| 93. | 00923 | 0.20% | 1.4%(-1.20)#93 | 11.4%(-11.2)#27,469 |
| 94. | 00718 | 0.20% | 1.4%(-1.20)#94 | 11.4%(-11.2)#27,470 |
| 95. | 00720 | 0.20% | 1.4%(-1.20)#95 | 11.4%(-11.2)#27,472 |
| 96. | 00962 | 0.20% | 1.4%(-1.20)#96 | 11.4%(-11.2)#27,473 |
| 97. | 00751 | 0.20% | 1.4%(-1.20)#97 | 11.4%(-11.2)#27,474 |
| 98. | 00723 | 0.20% | 1.4%(-1.20)#98 | 11.4%(-11.2)#27,476 |
| 99. | 00650 | 0.20% | 1.4%(-1.20)#99 | 11.4%(-11.2)#27,478 |
| 100. | 00735 | 0.20% | 1.4%(-1.20)#100 | 11.4%(-11.2)#27,480 |
1
2Common Questions
What are the Top 10 Zip Codes with the Highest Percentage of Households with Income Above $200,000 in Puerto Rico?
Top 10 Zip Codes with the Highest Percentage of Households with Income Above $200,000 in Puerto Rico are:
What zip code has the Highest Percentage of Households with Income Above $200,000 in Puerto Rico?
00694 has the Highest Percentage of Households with Income Above $200,000 in Puerto Rico with 26.9%.
What is the Percentage of Households with Income Above $200,000 in the State of Puerto Rico?
Percentage of Households with Income Above $200,000 in Puerto Rico is 1.4%.
What is the Percentage of Households with Income Above $200,000 in the United States?
Percentage of Households with Income Above $200,000 in the United States is 11.4%.