Zip Codes with the Highest Percentage of Population Employed in Sales & Related in Puerto Rico
RELATED REPORTS & OPTIONS
Sales & Related
Puerto Rico
Compare Zip Codes
Map of Zip Codes with the Highest Percentage of Population Employed in Sales & Related in Puerto Rico
0.0%
40.0%
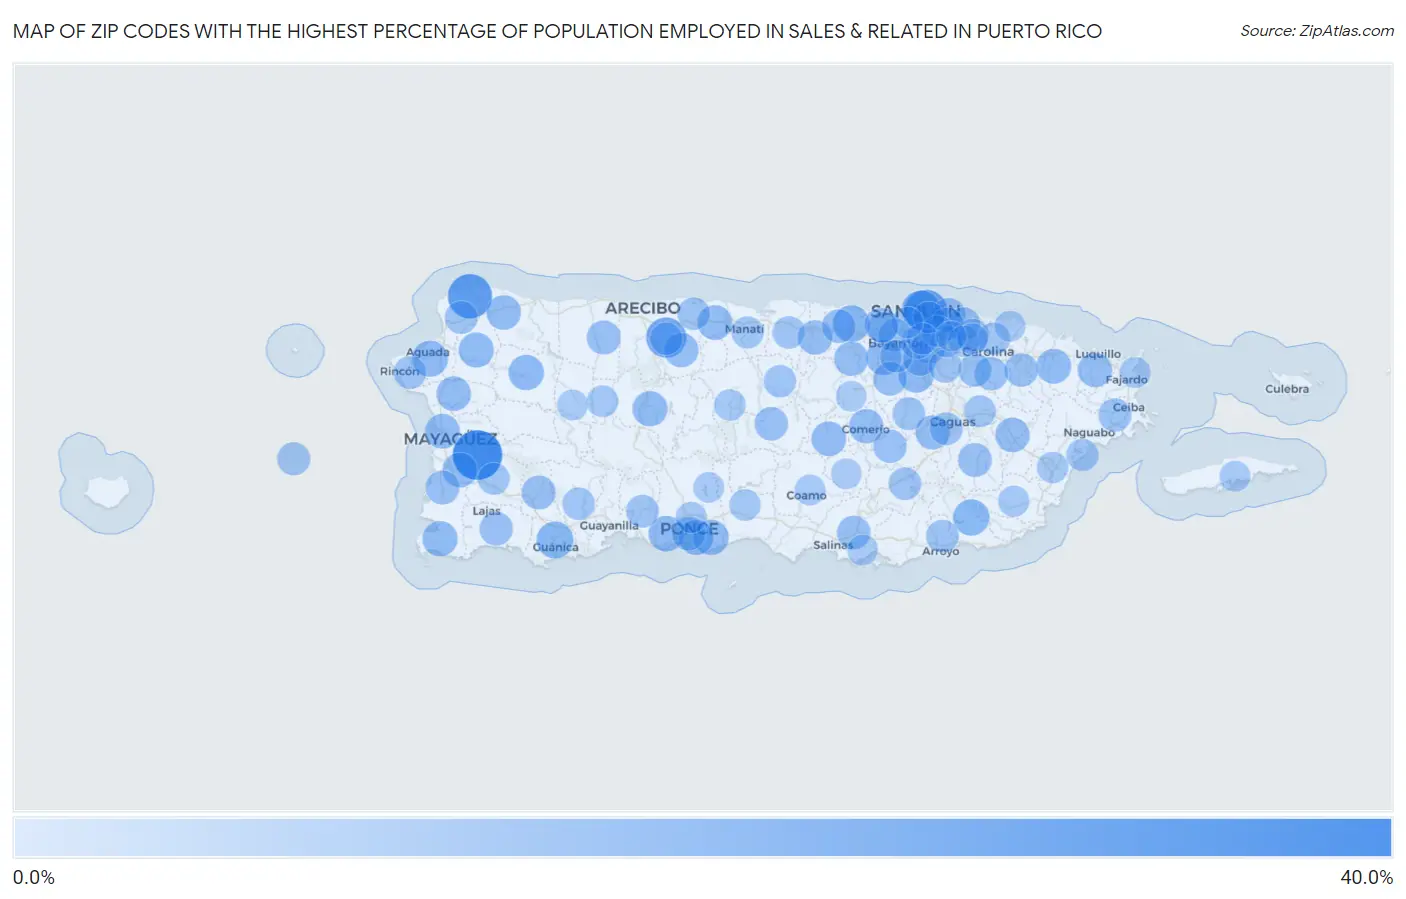
Zip Codes with the Highest Percentage of Population Employed in Sales & Related in Puerto Rico
| Zip Code | % Employed | vs State | vs National | |
| 1. | 00636 | 30.1% | 11.6% (+18.6)#1 | 9.6% (+20.5)#395 |
| 2. | 00690 | 24.2% | 11.6% (+12.6)#2 | 9.6% (+14.6)#700 |
| 3. | 00906 | 22.4% | 11.6% (+10.9)#3 | 9.6% (+12.9)#852 |
| 4. | 00616 | 19.7% | 11.6% (+8.13)#4 | 9.6% (+10.1)#1,201 |
| 5. | 00901 | 18.5% | 11.6% (+6.89)#5 | 9.6% (+8.86)#1,449 |
| 6. | 00951 | 16.0% | 11.6% (+4.47)#6 | 9.6% (+6.44)#2,221 |
| 7. | 00653 | 15.9% | 11.6% (+4.35)#7 | 9.6% (+6.33)#2,270 |
| 8. | 00723 | 15.4% | 11.6% (+3.84)#8 | 9.6% (+5.82)#2,519 |
| 9. | 00602 | 15.0% | 11.6% (+3.45)#9 | 9.6% (+5.42)#2,720 |
| 10. | 00728 | 14.5% | 11.6% (+2.97)#10 | 9.6% (+4.95)#3,054 |
| 11. | 00685 | 14.3% | 11.6% (+2.73)#11 | 9.6% (+4.70)#3,238 |
| 12. | 00957 | 14.3% | 11.6% (+2.72)#12 | 9.6% (+4.69)#3,281 |
| 13. | 00971 | 14.3% | 11.6% (+2.72)#13 | 9.6% (+4.69)#3,282 |
| 14. | 00715 | 14.2% | 11.6% (+2.61)#14 | 9.6% (+4.58)#3,337 |
| 15. | 00622 | 14.2% | 11.6% (+2.61)#15 | 9.6% (+4.58)#3,340 |
| 16. | 00641 | 14.1% | 11.6% (+2.55)#16 | 9.6% (+4.52)#3,382 |
| 17. | 00676 | 14.1% | 11.6% (+2.49)#17 | 9.6% (+4.46)#3,435 |
| 18. | 00716 | 13.9% | 11.6% (+2.32)#18 | 9.6% (+4.29)#3,570 |
| 19. | 00682 | 13.8% | 11.6% (+2.21)#19 | 9.6% (+4.19)#3,666 |
| 20. | 00745 | 13.8% | 11.6% (+2.21)#20 | 9.6% (+4.18)#3,673 |
| 21. | 00617 | 13.8% | 11.6% (+2.20)#21 | 9.6% (+4.17)#3,687 |
| 22. | 00660 | 13.7% | 11.6% (+2.15)#22 | 9.6% (+4.12)#3,737 |
| 23. | 00610 | 13.6% | 11.6% (+2.00)#23 | 9.6% (+3.97)#3,878 |
| 24. | 00794 | 13.5% | 11.6% (+1.94)#24 | 9.6% (+3.91)#3,932 |
| 25. | 00662 | 13.4% | 11.6% (+1.86)#25 | 9.6% (+3.83)#4,016 |
| 26. | 00692 | 13.4% | 11.6% (+1.84)#26 | 9.6% (+3.81)#4,029 |
| 27. | 00777 | 13.4% | 11.6% (+1.83)#27 | 9.6% (+3.81)#4,038 |
| 28. | 00688 | 13.4% | 11.6% (+1.80)#28 | 9.6% (+3.78)#4,066 |
| 29. | 00773 | 13.3% | 11.6% (+1.77)#29 | 9.6% (+3.75)#4,114 |
| 30. | 00782 | 13.3% | 11.6% (+1.76)#30 | 9.6% (+3.73)#4,137 |
| 31. | 00953 | 13.2% | 11.6% (+1.64)#31 | 9.6% (+3.61)#4,267 |
| 32. | 00921 | 13.2% | 11.6% (+1.59)#32 | 9.6% (+3.57)#4,319 |
| 33. | 00727 | 13.0% | 11.6% (+1.45)#33 | 9.6% (+3.43)#4,459 |
| 34. | 00949 | 13.0% | 11.6% (+1.42)#34 | 9.6% (+3.39)#4,495 |
| 35. | 00969 | 12.9% | 11.6% (+1.37)#35 | 9.6% (+3.35)#4,543 |
| 36. | 00659 | 12.9% | 11.6% (+1.29)#36 | 9.6% (+3.27)#4,655 |
| 37. | 00623 | 12.8% | 11.6% (+1.25)#37 | 9.6% (+3.22)#4,724 |
| 38. | 00637 | 12.8% | 11.6% (+1.19)#38 | 9.6% (+3.16)#4,815 |
| 39. | 00913 | 12.7% | 11.6% (+1.11)#39 | 9.6% (+3.09)#4,903 |
| 40. | 00956 | 12.6% | 11.6% (+1.06)#40 | 9.6% (+3.03)#4,977 |
| 41. | 00754 | 12.6% | 11.6% (+1.04)#41 | 9.6% (+3.01)#5,001 |
| 42. | 00646 | 12.6% | 11.6% (+1.03)#42 | 9.6% (+3.00)#5,015 |
| 43. | 00720 | 12.4% | 11.6% (+0.860)#43 | 9.6% (+2.83)#5,281 |
| 44. | 00751 | 12.4% | 11.6% (+0.815)#44 | 9.6% (+2.79)#5,354 |
| 45. | 00667 | 12.3% | 11.6% (+0.718)#45 | 9.6% (+2.69)#5,504 |
| 46. | 00717 | 12.3% | 11.6% (+0.714)#46 | 9.6% (+2.69)#5,512 |
| 47. | 00729 | 12.3% | 11.6% (+0.706)#47 | 9.6% (+2.68)#5,525 |
| 48. | 00739 | 12.2% | 11.6% (+0.646)#48 | 9.6% (+2.62)#5,637 |
| 49. | 00987 | 12.2% | 11.6% (+0.616)#49 | 9.6% (+2.59)#5,695 |
| 50. | 00976 | 12.2% | 11.6% (+0.614)#50 | 9.6% (+2.59)#5,696 |
| 51. | 00680 | 12.0% | 11.6% (+0.382)#51 | 9.6% (+2.36)#6,139 |
| 52. | 00735 | 11.9% | 11.6% (+0.366)#52 | 9.6% (+2.34)#6,161 |
| 53. | 00961 | 11.9% | 11.6% (+0.350)#53 | 9.6% (+2.32)#6,193 |
| 54. | 00926 | 11.7% | 11.6% (+0.143)#54 | 9.6% (+2.12)#6,583 |
| 55. | 00966 | 11.7% | 11.6% (+0.104)#55 | 9.6% (+2.08)#6,663 |
| 56. | 00979 | 11.6% | 11.6% (+0.078)#56 | 9.6% (+2.05)#6,719 |
| 57. | 00725 | 11.6% | 11.6% (+0.022)#57 | 9.6% (+1.99)#6,821 |
| 58. | 00983 | 11.5% | 11.6% (-0.035)#58 | 9.6% (+1.94)#6,942 |
| 59. | 00603 | 11.5% | 11.6% (-0.042)#59 | 9.6% (+1.93)#6,955 |
| 60. | 00624 | 11.5% | 11.6% (-0.084)#60 | 9.6% (+1.89)#7,049 |
| 61. | 00677 | 11.5% | 11.6% (-0.087)#61 | 9.6% (+1.89)#7,058 |
| 62. | 00714 | 11.5% | 11.6% (-0.090)#62 | 9.6% (+1.88)#7,068 |
| 63. | 00703 | 11.4% | 11.6% (-0.123)#63 | 9.6% (+1.85)#7,146 |
| 64. | 00736 | 11.4% | 11.6% (-0.201)#64 | 9.6% (+1.77)#7,316 |
| 65. | 00652 | 11.3% | 11.6% (-0.251)#65 | 9.6% (+1.72)#7,435 |
| 66. | 00612 | 11.3% | 11.6% (-0.272)#66 | 9.6% (+1.70)#7,480 |
| 67. | 00959 | 11.3% | 11.6% (-0.298)#67 | 9.6% (+1.67)#7,549 |
| 68. | 00698 | 11.2% | 11.6% (-0.331)#68 | 9.6% (+1.64)#7,617 |
| 69. | 00985 | 11.2% | 11.6% (-0.398)#69 | 9.6% (+1.58)#7,772 |
| 70. | 00687 | 11.1% | 11.6% (-0.432)#70 | 9.6% (+1.54)#7,861 |
| 71. | 00693 | 11.1% | 11.6% (-0.450)#71 | 9.6% (+1.52)#7,891 |
| 72. | 00915 | 11.1% | 11.6% (-0.493)#72 | 9.6% (+1.48)#8,015 |
| 73. | 00741 | 11.0% | 11.6% (-0.568)#73 | 9.6% (+1.40)#8,201 |
| 74. | 00925 | 11.0% | 11.6% (-0.614)#74 | 9.6% (+1.36)#8,316 |
| 75. | 00674 | 10.7% | 11.6% (-0.830)#75 | 9.6% (+1.14)#8,876 |
| 76. | 00683 | 10.6% | 11.6% (-1.000)#76 | 9.6% (+0.974)#9,366 |
| 77. | 00918 | 10.5% | 11.6% (-1.06)#77 | 9.6% (+0.917)#9,490 |
| 78. | 00778 | 10.5% | 11.6% (-1.11)#78 | 9.6% (+0.865)#9,635 |
| 79. | 00907 | 10.4% | 11.6% (-1.20)#79 | 9.6% (+0.777)#9,893 |
| 80. | 00611 | 10.3% | 11.6% (-1.25)#80 | 9.6% (+0.719)#10,068 |
| 81. | 00968 | 10.2% | 11.6% (-1.36)#81 | 9.6% (+0.616)#10,390 |
| 82. | 00795 | 10.1% | 11.6% (-1.45)#82 | 9.6% (+0.525)#10,655 |
| 83. | 00791 | 10.0% | 11.6% (-1.54)#83 | 9.6% (+0.433)#10,921 |
| 84. | 00962 | 10.0% | 11.6% (-1.57)#84 | 9.6% (+0.403)#11,029 |
| 85. | 00638 | 10.0% | 11.6% (-1.57)#85 | 9.6% (+0.400)#11,040 |
| 86. | 00730 | 9.7% | 11.6% (-1.83)#86 | 9.6% (+0.138)#11,913 |
| 87. | 00767 | 9.7% | 11.6% (-1.88)#87 | 9.6% (+0.093)#12,080 |
| 88. | 00924 | 9.7% | 11.6% (-1.88)#88 | 9.6% (+0.090)#12,088 |
| 89. | 00738 | 9.7% | 11.6% (-1.90)#89 | 9.6% (+0.071)#12,154 |
| 90. | 00982 | 9.5% | 11.6% (-2.07)#90 | 9.6% (-0.098)#12,753 |
| 91. | 00952 | 9.5% | 11.6% (-2.10)#91 | 9.6% (-0.131)#12,858 |
| 92. | 00769 | 9.4% | 11.6% (-2.15)#92 | 9.6% (-0.176)#13,020 |
| 93. | 00772 | 9.4% | 11.6% (-2.19)#93 | 9.6% (-0.217)#13,149 |
| 94. | 00669 | 9.4% | 11.6% (-2.20)#94 | 9.6% (-0.225)#13,181 |
| 95. | 00765 | 9.3% | 11.6% (-2.27)#95 | 9.6% (-0.294)#13,427 |
| 96. | 00704 | 9.2% | 11.6% (-2.35)#96 | 9.6% (-0.377)#13,715 |
| 97. | 00719 | 9.2% | 11.6% (-2.35)#97 | 9.6% (-0.380)#13,734 |
| 98. | 00780 | 9.2% | 11.6% (-2.37)#98 | 9.6% (-0.397)#13,792 |
| 99. | 00705 | 9.2% | 11.6% (-2.39)#99 | 9.6% (-0.419)#13,887 |
| 100. | 00923 | 9.0% | 11.6% (-2.60)#100 | 9.6% (-0.629)#14,630 |
1
2Common Questions
What are the Top 10 Zip Codes with the Highest Percentage of Population Employed in Sales & Related in Puerto Rico?
Top 10 Zip Codes with the Highest Percentage of Population Employed in Sales & Related in Puerto Rico are:
What zip code has the Highest Percentage of Population Employed in Sales & Related in Puerto Rico?
00636 has the Highest Percentage of Population Employed in Sales & Related in Puerto Rico with 30.1%.
What is the Percentage of Population Employed in Sales & Related in the State of Puerto Rico?
Percentage of Population Employed in Sales & Related in Puerto Rico is 11.6%.
What is the Percentage of Population Employed in Sales & Related in the United States?
Percentage of Population Employed in Sales & Related in the United States is 9.6%.