Zip Codes with the Highest Percentage of Population Employed in Agriculture, Fishing & Hunting in Henderson, NV
RELATED REPORTS & OPTIONS
Agriculture, Fishing & Hunting
Henderson
Compare Zip Codes
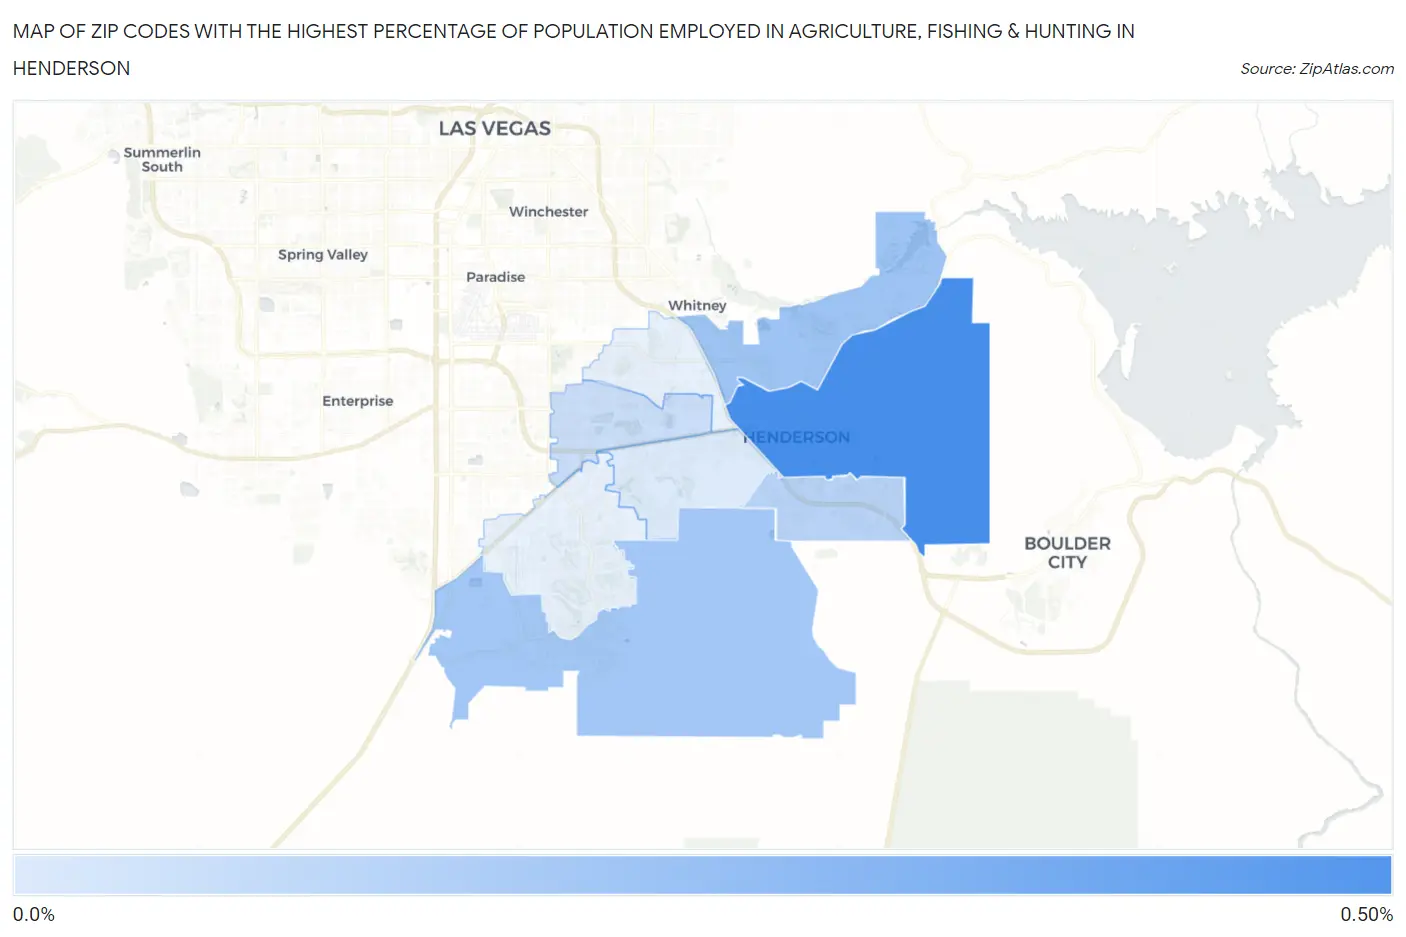
Map of Zip Codes with the Highest Percentage of Population Employed in Agriculture, Fishing & Hunting in Henderson
0.074%
0.44%
Zip Codes with the Highest Percentage of Population Employed in Agriculture, Fishing & Hunting in Henderson, NV
| Zip Code | % Employed | vs State | vs National | |
| 1. | 89015 | 0.44% | 0.40%(+0.043)#59 | 1.2%(-0.760)#19,804 |
| 2. | 89011 | 0.23% | 0.40%(-0.170)#76 | 1.2%(-0.973)#22,035 |
| 3. | 89044 | 0.21% | 0.40%(-0.184)#79 | 1.2%(-0.988)#22,220 |
| 4. | 89002 | 0.16% | 0.40%(-0.234)#84 | 1.2%(-1.04)#22,847 |
| 5. | 89074 | 0.12% | 0.40%(-0.274)#89 | 1.2%(-1.08)#23,391 |
| 6. | 89012 | 0.074% | 0.40%(-0.322)#97 | 1.2%(-1.13)#24,051 |
1
Common Questions
What are the Top 5 Zip Codes with the Highest Percentage of Population Employed in Agriculture, Fishing & Hunting in Henderson, NV?
Top 5 Zip Codes with the Highest Percentage of Population Employed in Agriculture, Fishing & Hunting in Henderson, NV are:
What zip code has the Highest Percentage of Population Employed in Agriculture, Fishing & Hunting in Henderson, NV?
89015 has the Highest Percentage of Population Employed in Agriculture, Fishing & Hunting in Henderson, NV with 0.44%.
What is the Percentage of Population Employed in Agriculture, Fishing & Hunting in Henderson, NV?
Percentage of Population Employed in Agriculture, Fishing & Hunting in Henderson is 0.14%.
What is the Percentage of Population Employed in Agriculture, Fishing & Hunting in Nevada?
Percentage of Population Employed in Agriculture, Fishing & Hunting in Nevada is 0.40%.
What is the Percentage of Population Employed in Agriculture, Fishing & Hunting in the United States?
Percentage of Population Employed in Agriculture, Fishing & Hunting in the United States is 1.2%.