Zip Codes with the Highest Percentage of Immigrants from Eastern Asia in Henderson, NV
RELATED REPORTS & OPTIONS
Eastern Asia
Henderson
Compare Zip Codes
Map of Zip Codes with the Highest Percentage of Immigrants from Eastern Asia in Henderson
0.29%
4.18%
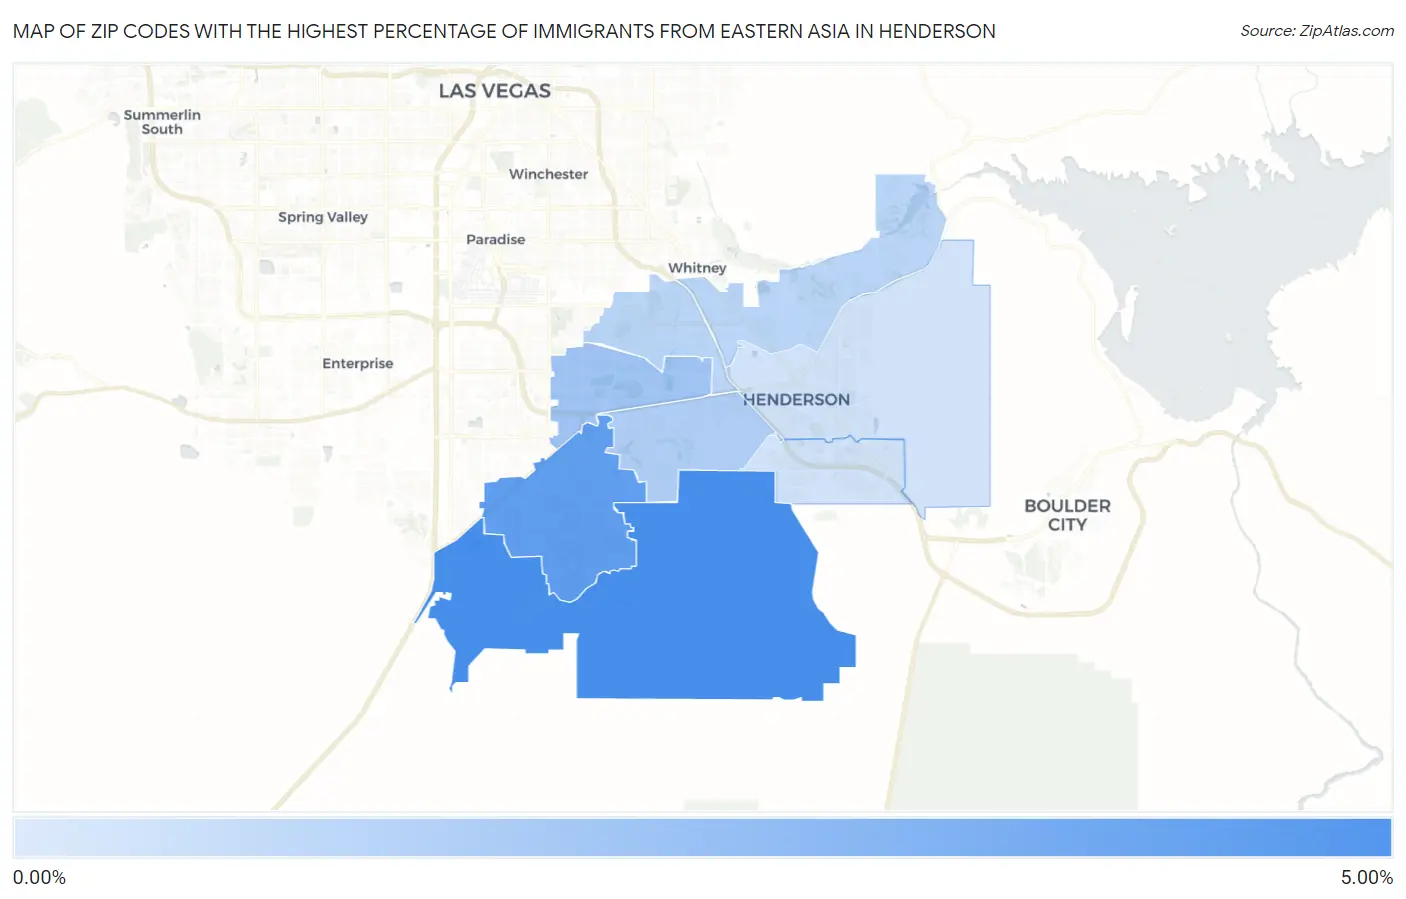
Zip Codes with the Highest Percentage of Immigrants from Eastern Asia in Henderson, NV
| Zip Code | Eastern Asia | vs State | vs National | |
| 1. | 89044 | 4.18% | 1.39% (+2.79)#8 | 1.28% (+2.91)#912 |
| 2. | 89052 | 3.45% | 1.39% (+2.06)#14 | 1.28% (+2.18)#1,139 |
| 3. | 89074 | 1.63% | 1.39% (+0.233)#27 | 1.28% (+0.351)#2,477 |
| 4. | 89012 | 1.27% | 1.39% (-0.127)#35 | 1.28% (-0.010)#3,126 |
| 5. | 89014 | 0.97% | 1.39% (-0.419)#42 | 1.28% (-0.301)#3,984 |
| 6. | 89011 | 0.96% | 1.39% (-0.438)#43 | 1.28% (-0.320)#4,062 |
| 7. | 89015 | 0.32% | 1.39% (-1.07)#85 | 1.28% (-0.957)#8,532 |
| 8. | 89002 | 0.29% | 1.39% (-1.10)#87 | 1.28% (-0.987)#8,916 |
1
Common Questions
What are the Top 5 Zip Codes with the Highest Percentage of Immigrants from Eastern Asia in Henderson, NV?
Top 5 Zip Codes with the Highest Percentage of Immigrants from Eastern Asia in Henderson, NV are:
What zip code has the Highest Percentage of Immigrants from Eastern Asia in Henderson, NV?
89044 has the Highest Percentage of Immigrants from Eastern Asia in Henderson, NV with 4.18%.
What is the Percentage of Immigrants from Eastern Asia in Henderson, NV?
Percentage of Immigrants from Eastern Asia in Henderson is 1.67%.
What is the Percentage of Immigrants from Eastern Asia in Nevada?
Percentage of Immigrants from Eastern Asia in Nevada is 1.39%.
What is the Percentage of Immigrants from Eastern Asia in the United States?
Percentage of Immigrants from Eastern Asia in the United States is 1.28%.