Zip Codes with the Highest Percentage of Population with a Degree in Visual and Performing Arts in Henderson, NV
RELATED REPORTS & OPTIONS
Visual and Performing Arts
Henderson
Compare Zip Codes
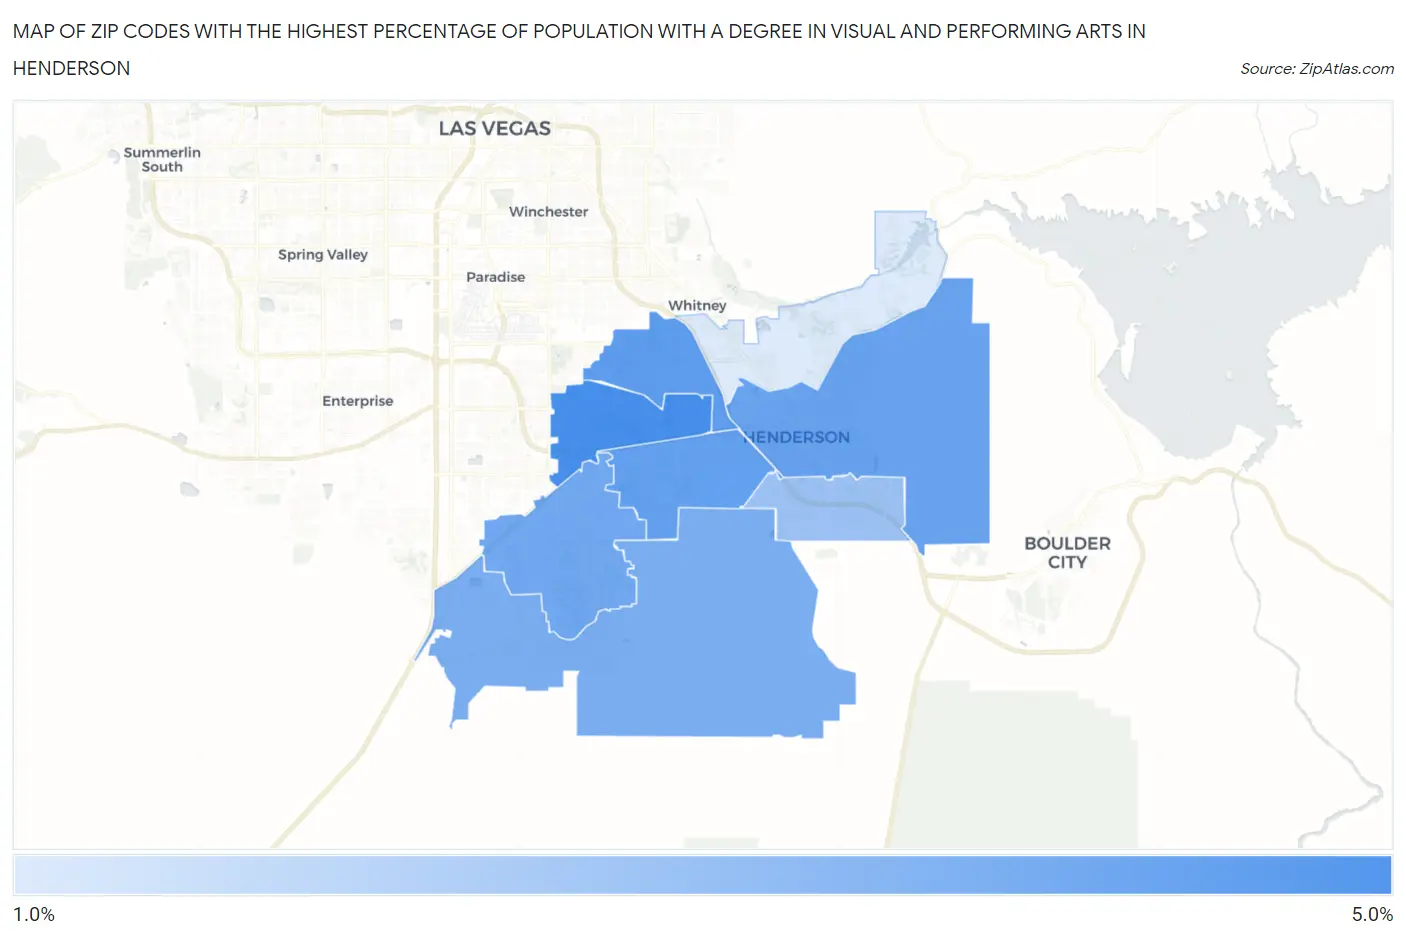
Map of Zip Codes with the Highest Percentage of Population with a Degree in Visual and Performing Arts in Henderson
1.4%
4.7%
Zip Codes with the Highest Percentage of Population with a Degree in Visual and Performing Arts in Henderson, NV
| Zip Code | % Graduates | vs State | vs National | |
| 1. | 89074 | 4.7% | 3.8%(+0.925)#36 | 4.3%(+0.465)#7,263 |
| 2. | 89014 | 4.2% | 3.8%(+0.408)#43 | 4.3%(-0.051)#8,623 |
| 3. | 89012 | 4.1% | 3.8%(+0.330)#45 | 4.3%(-0.129)#8,862 |
| 4. | 89015 | 4.0% | 3.8%(+0.211)#48 | 4.3%(-0.249)#9,254 |
| 5. | 89052 | 3.8% | 3.8%(-0.017)#50 | 4.3%(-0.477)#9,922 |
| 6. | 89044 | 3.6% | 3.8%(-0.204)#56 | 4.3%(-0.663)#10,537 |
| 7. | 89002 | 2.8% | 3.8%(-0.948)#76 | 4.3%(-1.41)#13,312 |
| 8. | 89011 | 1.4% | 3.8%(-2.35)#101 | 4.3%(-2.81)#18,345 |
1
Common Questions
What are the Top 5 Zip Codes with the Highest Percentage of Population with a Degree in Visual and Performing Arts in Henderson, NV?
Top 5 Zip Codes with the Highest Percentage of Population with a Degree in Visual and Performing Arts in Henderson, NV are:
What zip code has the Highest Percentage of Population with a Degree in Visual and Performing Arts in Henderson, NV?
89074 has the Highest Percentage of Population with a Degree in Visual and Performing Arts in Henderson, NV with 4.7%.
What is the Percentage of Population with a Degree in Visual and Performing Arts in Henderson, NV?
Percentage of Population with a Degree in Visual and Performing Arts in Henderson is 3.7%.
What is the Percentage of Population with a Degree in Visual and Performing Arts in Nevada?
Percentage of Population with a Degree in Visual and Performing Arts in Nevada is 3.8%.
What is the Percentage of Population with a Degree in Visual and Performing Arts in the United States?
Percentage of Population with a Degree in Visual and Performing Arts in the United States is 4.3%.